


Quant Exam > Quant Questions > (Q.no: 1-5). Refer to the following Line Grap...
Start Learning for Free

(Q.no: 1-5). Refer to the following Line Graph and answer the given questions.
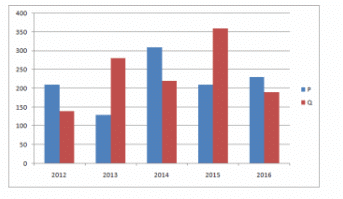
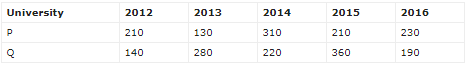
Number of applications received for University Q increased by what percent from 2012 to 2014?
- a)100/7%
- b)200/7%
- c)300/7%
- d)400/7%
- e)None of the
Correct answer is option 'D'. Can you explain this answer?
| FREE This question is part of | Download PDF Attempt this Test |
Verified Answer
(Q.no: 1-5). Refer to the following Line Graph and answer the given qu...
% = (220-140)/140 * 100 = 400/7 %
Most Upvoted Answer
(Q.no: 1-5). Refer to the following Line Graph and answer the given qu...
Ans----- Q
2012-140
2014-220 increase=220-140=80
%increased=80/140×100====400/7% ans...
2012-140
2014-220 increase=220-140=80
%increased=80/140×100====400/7% ans...
Free Test
FREE
| Start Free Test |
Community Answer
(Q.no: 1-5). Refer to the following Line Graph and answer the given qu...
In base we use 140 because it is asking from 2012

|
Explore Courses for Quant exam
|
|
Similar Quant Doubts


(Q.no: 1-5). Refer to the following Line Graph and answer the given questions.Number of applications received for University Q increased by what percent from 2012 to 2014?a)100/7%b)200/7%c)300/7%d)400/7%e)None of theCorrect answer is option 'D'. Can you explain this answer?
Question Description
(Q.no: 1-5). Refer to the following Line Graph and answer the given questions.Number of applications received for University Q increased by what percent from 2012 to 2014?a)100/7%b)200/7%c)300/7%d)400/7%e)None of theCorrect answer is option 'D'. Can you explain this answer? for Quant 2024 is part of Quant preparation. The Question and answers have been prepared according to the Quant exam syllabus. Information about (Q.no: 1-5). Refer to the following Line Graph and answer the given questions.Number of applications received for University Q increased by what percent from 2012 to 2014?a)100/7%b)200/7%c)300/7%d)400/7%e)None of theCorrect answer is option 'D'. Can you explain this answer? covers all topics & solutions for Quant 2024 Exam. Find important definitions, questions, meanings, examples, exercises and tests below for (Q.no: 1-5). Refer to the following Line Graph and answer the given questions.Number of applications received for University Q increased by what percent from 2012 to 2014?a)100/7%b)200/7%c)300/7%d)400/7%e)None of theCorrect answer is option 'D'. Can you explain this answer?.
(Q.no: 1-5). Refer to the following Line Graph and answer the given questions.Number of applications received for University Q increased by what percent from 2012 to 2014?a)100/7%b)200/7%c)300/7%d)400/7%e)None of theCorrect answer is option 'D'. Can you explain this answer? for Quant 2024 is part of Quant preparation. The Question and answers have been prepared according to the Quant exam syllabus. Information about (Q.no: 1-5). Refer to the following Line Graph and answer the given questions.Number of applications received for University Q increased by what percent from 2012 to 2014?a)100/7%b)200/7%c)300/7%d)400/7%e)None of theCorrect answer is option 'D'. Can you explain this answer? covers all topics & solutions for Quant 2024 Exam. Find important definitions, questions, meanings, examples, exercises and tests below for (Q.no: 1-5). Refer to the following Line Graph and answer the given questions.Number of applications received for University Q increased by what percent from 2012 to 2014?a)100/7%b)200/7%c)300/7%d)400/7%e)None of theCorrect answer is option 'D'. Can you explain this answer?.
Solutions for (Q.no: 1-5). Refer to the following Line Graph and answer the given questions.Number of applications received for University Q increased by what percent from 2012 to 2014?a)100/7%b)200/7%c)300/7%d)400/7%e)None of theCorrect answer is option 'D'. Can you explain this answer? in English & in Hindi are available as part of our courses for Quant.
Download more important topics, notes, lectures and mock test series for Quant Exam by signing up for free.
Here you can find the meaning of (Q.no: 1-5). Refer to the following Line Graph and answer the given questions.Number of applications received for University Q increased by what percent from 2012 to 2014?a)100/7%b)200/7%c)300/7%d)400/7%e)None of theCorrect answer is option 'D'. Can you explain this answer? defined & explained in the simplest way possible. Besides giving the explanation of
(Q.no: 1-5). Refer to the following Line Graph and answer the given questions.Number of applications received for University Q increased by what percent from 2012 to 2014?a)100/7%b)200/7%c)300/7%d)400/7%e)None of theCorrect answer is option 'D'. Can you explain this answer?, a detailed solution for (Q.no: 1-5). Refer to the following Line Graph and answer the given questions.Number of applications received for University Q increased by what percent from 2012 to 2014?a)100/7%b)200/7%c)300/7%d)400/7%e)None of theCorrect answer is option 'D'. Can you explain this answer? has been provided alongside types of (Q.no: 1-5). Refer to the following Line Graph and answer the given questions.Number of applications received for University Q increased by what percent from 2012 to 2014?a)100/7%b)200/7%c)300/7%d)400/7%e)None of theCorrect answer is option 'D'. Can you explain this answer? theory, EduRev gives you an
ample number of questions to practice (Q.no: 1-5). Refer to the following Line Graph and answer the given questions.Number of applications received for University Q increased by what percent from 2012 to 2014?a)100/7%b)200/7%c)300/7%d)400/7%e)None of theCorrect answer is option 'D'. Can you explain this answer? tests, examples and also practice Quant tests.
|
|
Explore Courses for Quant exam
|
|
Suggested Free Tests
Signup for Free!
Signup to see your scores go up within 7 days! Learn & Practice with 1000+ FREE Notes, Videos & Tests.


|
© EduRev
|
Education Revolution
|


|


Signup to see your scores
go up within 7 days!
Access 1000+ FREE Docs, Videos and Tests
Takes less than 10 seconds to signup