


JEE Exam > JEE Questions > In the Figure, isotherms of CO2 at several te...
Start Learning for Free

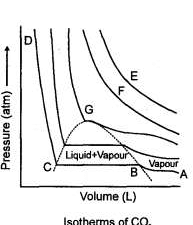
In the Figure, isotherms of CO2 at several temperatures near the critical point are shown. At the critical point (critical state), the distinction between the liquid and gaseous states disappear and the density of the gaseous substance is equal to that in the liquid state. For every gas this occurs at specific values of temperature and pressure, called critical temperature and critical pressure respectively. At temperatures and pressures above the critical point value, a gas is said be in a supercritical state. Critical constants are evaluated by solving the Vander W aals equation which is a cubic in volume. The values are Tc

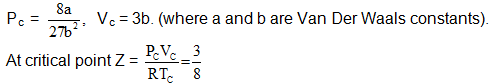
In the supercritical region the behaviour is studied by plotting Z vs P plots. The variation in this region is studied with respect to boyles temperature a

At temperature
higher than CB the variation is linear (Plot I) and at temperature lower than CB the variation is non linear (Plot II) With reference to the passage answers the following questions:
higher than CB the variation is linear (Plot I) and at temperature lower than CB the variation is non linear (Plot II) With reference to the passage answers the following questions:
Q.
The figure shows the effect of pressure on the compressibility factor, Z of a gas :The wrong conclusion(s) is/are:
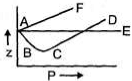
- a)The curve AE can be explained by PV = RT
- b)The curve AF and CD can be explained by PV = KT + Pb
- c)The curve AB can be explained by PV = RT -a/V
- d)All the three curves AF, AE and AD shows the real behaviour
Correct answer is option 'D'. Can you explain this answer?
| FREE This question is part of | Download PDF Attempt this Test |

|
Explore Courses for JEE exam
|
|
Similar JEE Doubts


Top Courses for JEEView all


In the Figure, isotherms of CO2 at several temperatures near the critical point are shown. At the critical point (critical state), the distinction between the liquid and gaseous states disappear and the density of the gaseous substance is equal to that in the liquid state. For every gas this occurs at specific values of temperature and pressure, called critical temperature and critical pressure respectively. At temperatures and pressures above the critical point value, a gas is said be in a supercritical state. Critical constants are evaluated by solving the Vander W aals equation which is a cubic involume. The values are TcIn the supercritical region the behaviour is studied by plotting Z vs P plots. The variation in this region is studied with respect to boyles temperature aAt temperaturehigher than CB the variation is linear (Plot I) and at temperature lower than CB the variation is non linear (Plot II) With reference to the passage answers the following questions:Q.The figure shows the effect of pressure on the compressibility factor, Z of a gas :The wrong conclusion(s) is/are:a)The curve AE can be explained by PV = RTb)The curve AF and CD can be explained by PV = KT + Pbc)The curve AB can be explained by PV = RT -a/Vd)All the three curves AF, AE and AD shows the real behaviourCorrect answer is option 'D'. Can you explain this answer?
Question Description
In the Figure, isotherms of CO2 at several temperatures near the critical point are shown. At the critical point (critical state), the distinction between the liquid and gaseous states disappear and the density of the gaseous substance is equal to that in the liquid state. For every gas this occurs at specific values of temperature and pressure, called critical temperature and critical pressure respectively. At temperatures and pressures above the critical point value, a gas is said be in a supercritical state. Critical constants are evaluated by solving the Vander W aals equation which is a cubic involume. The values are TcIn the supercritical region the behaviour is studied by plotting Z vs P plots. The variation in this region is studied with respect to boyles temperature aAt temperaturehigher than CB the variation is linear (Plot I) and at temperature lower than CB the variation is non linear (Plot II) With reference to the passage answers the following questions:Q.The figure shows the effect of pressure on the compressibility factor, Z of a gas :The wrong conclusion(s) is/are:a)The curve AE can be explained by PV = RTb)The curve AF and CD can be explained by PV = KT + Pbc)The curve AB can be explained by PV = RT -a/Vd)All the three curves AF, AE and AD shows the real behaviourCorrect answer is option 'D'. Can you explain this answer? for JEE 2024 is part of JEE preparation. The Question and answers have been prepared according to the JEE exam syllabus. Information about In the Figure, isotherms of CO2 at several temperatures near the critical point are shown. At the critical point (critical state), the distinction between the liquid and gaseous states disappear and the density of the gaseous substance is equal to that in the liquid state. For every gas this occurs at specific values of temperature and pressure, called critical temperature and critical pressure respectively. At temperatures and pressures above the critical point value, a gas is said be in a supercritical state. Critical constants are evaluated by solving the Vander W aals equation which is a cubic involume. The values are TcIn the supercritical region the behaviour is studied by plotting Z vs P plots. The variation in this region is studied with respect to boyles temperature aAt temperaturehigher than CB the variation is linear (Plot I) and at temperature lower than CB the variation is non linear (Plot II) With reference to the passage answers the following questions:Q.The figure shows the effect of pressure on the compressibility factor, Z of a gas :The wrong conclusion(s) is/are:a)The curve AE can be explained by PV = RTb)The curve AF and CD can be explained by PV = KT + Pbc)The curve AB can be explained by PV = RT -a/Vd)All the three curves AF, AE and AD shows the real behaviourCorrect answer is option 'D'. Can you explain this answer? covers all topics & solutions for JEE 2024 Exam. Find important definitions, questions, meanings, examples, exercises and tests below for In the Figure, isotherms of CO2 at several temperatures near the critical point are shown. At the critical point (critical state), the distinction between the liquid and gaseous states disappear and the density of the gaseous substance is equal to that in the liquid state. For every gas this occurs at specific values of temperature and pressure, called critical temperature and critical pressure respectively. At temperatures and pressures above the critical point value, a gas is said be in a supercritical state. Critical constants are evaluated by solving the Vander W aals equation which is a cubic involume. The values are TcIn the supercritical region the behaviour is studied by plotting Z vs P plots. The variation in this region is studied with respect to boyles temperature aAt temperaturehigher than CB the variation is linear (Plot I) and at temperature lower than CB the variation is non linear (Plot II) With reference to the passage answers the following questions:Q.The figure shows the effect of pressure on the compressibility factor, Z of a gas :The wrong conclusion(s) is/are:a)The curve AE can be explained by PV = RTb)The curve AF and CD can be explained by PV = KT + Pbc)The curve AB can be explained by PV = RT -a/Vd)All the three curves AF, AE and AD shows the real behaviourCorrect answer is option 'D'. Can you explain this answer?.
In the Figure, isotherms of CO2 at several temperatures near the critical point are shown. At the critical point (critical state), the distinction between the liquid and gaseous states disappear and the density of the gaseous substance is equal to that in the liquid state. For every gas this occurs at specific values of temperature and pressure, called critical temperature and critical pressure respectively. At temperatures and pressures above the critical point value, a gas is said be in a supercritical state. Critical constants are evaluated by solving the Vander W aals equation which is a cubic involume. The values are TcIn the supercritical region the behaviour is studied by plotting Z vs P plots. The variation in this region is studied with respect to boyles temperature aAt temperaturehigher than CB the variation is linear (Plot I) and at temperature lower than CB the variation is non linear (Plot II) With reference to the passage answers the following questions:Q.The figure shows the effect of pressure on the compressibility factor, Z of a gas :The wrong conclusion(s) is/are:a)The curve AE can be explained by PV = RTb)The curve AF and CD can be explained by PV = KT + Pbc)The curve AB can be explained by PV = RT -a/Vd)All the three curves AF, AE and AD shows the real behaviourCorrect answer is option 'D'. Can you explain this answer? for JEE 2024 is part of JEE preparation. The Question and answers have been prepared according to the JEE exam syllabus. Information about In the Figure, isotherms of CO2 at several temperatures near the critical point are shown. At the critical point (critical state), the distinction between the liquid and gaseous states disappear and the density of the gaseous substance is equal to that in the liquid state. For every gas this occurs at specific values of temperature and pressure, called critical temperature and critical pressure respectively. At temperatures and pressures above the critical point value, a gas is said be in a supercritical state. Critical constants are evaluated by solving the Vander W aals equation which is a cubic involume. The values are TcIn the supercritical region the behaviour is studied by plotting Z vs P plots. The variation in this region is studied with respect to boyles temperature aAt temperaturehigher than CB the variation is linear (Plot I) and at temperature lower than CB the variation is non linear (Plot II) With reference to the passage answers the following questions:Q.The figure shows the effect of pressure on the compressibility factor, Z of a gas :The wrong conclusion(s) is/are:a)The curve AE can be explained by PV = RTb)The curve AF and CD can be explained by PV = KT + Pbc)The curve AB can be explained by PV = RT -a/Vd)All the three curves AF, AE and AD shows the real behaviourCorrect answer is option 'D'. Can you explain this answer? covers all topics & solutions for JEE 2024 Exam. Find important definitions, questions, meanings, examples, exercises and tests below for In the Figure, isotherms of CO2 at several temperatures near the critical point are shown. At the critical point (critical state), the distinction between the liquid and gaseous states disappear and the density of the gaseous substance is equal to that in the liquid state. For every gas this occurs at specific values of temperature and pressure, called critical temperature and critical pressure respectively. At temperatures and pressures above the critical point value, a gas is said be in a supercritical state. Critical constants are evaluated by solving the Vander W aals equation which is a cubic involume. The values are TcIn the supercritical region the behaviour is studied by plotting Z vs P plots. The variation in this region is studied with respect to boyles temperature aAt temperaturehigher than CB the variation is linear (Plot I) and at temperature lower than CB the variation is non linear (Plot II) With reference to the passage answers the following questions:Q.The figure shows the effect of pressure on the compressibility factor, Z of a gas :The wrong conclusion(s) is/are:a)The curve AE can be explained by PV = RTb)The curve AF and CD can be explained by PV = KT + Pbc)The curve AB can be explained by PV = RT -a/Vd)All the three curves AF, AE and AD shows the real behaviourCorrect answer is option 'D'. Can you explain this answer?.
Solutions for In the Figure, isotherms of CO2 at several temperatures near the critical point are shown. At the critical point (critical state), the distinction between the liquid and gaseous states disappear and the density of the gaseous substance is equal to that in the liquid state. For every gas this occurs at specific values of temperature and pressure, called critical temperature and critical pressure respectively. At temperatures and pressures above the critical point value, a gas is said be in a supercritical state. Critical constants are evaluated by solving the Vander W aals equation which is a cubic involume. The values are TcIn the supercritical region the behaviour is studied by plotting Z vs P plots. The variation in this region is studied with respect to boyles temperature aAt temperaturehigher than CB the variation is linear (Plot I) and at temperature lower than CB the variation is non linear (Plot II) With reference to the passage answers the following questions:Q.The figure shows the effect of pressure on the compressibility factor, Z of a gas :The wrong conclusion(s) is/are:a)The curve AE can be explained by PV = RTb)The curve AF and CD can be explained by PV = KT + Pbc)The curve AB can be explained by PV = RT -a/Vd)All the three curves AF, AE and AD shows the real behaviourCorrect answer is option 'D'. Can you explain this answer? in English & in Hindi are available as part of our courses for JEE.
Download more important topics, notes, lectures and mock test series for JEE Exam by signing up for free.
Here you can find the meaning of In the Figure, isotherms of CO2 at several temperatures near the critical point are shown. At the critical point (critical state), the distinction between the liquid and gaseous states disappear and the density of the gaseous substance is equal to that in the liquid state. For every gas this occurs at specific values of temperature and pressure, called critical temperature and critical pressure respectively. At temperatures and pressures above the critical point value, a gas is said be in a supercritical state. Critical constants are evaluated by solving the Vander W aals equation which is a cubic involume. The values are TcIn the supercritical region the behaviour is studied by plotting Z vs P plots. The variation in this region is studied with respect to boyles temperature aAt temperaturehigher than CB the variation is linear (Plot I) and at temperature lower than CB the variation is non linear (Plot II) With reference to the passage answers the following questions:Q.The figure shows the effect of pressure on the compressibility factor, Z of a gas :The wrong conclusion(s) is/are:a)The curve AE can be explained by PV = RTb)The curve AF and CD can be explained by PV = KT + Pbc)The curve AB can be explained by PV = RT -a/Vd)All the three curves AF, AE and AD shows the real behaviourCorrect answer is option 'D'. Can you explain this answer? defined & explained in the simplest way possible. Besides giving the explanation of
In the Figure, isotherms of CO2 at several temperatures near the critical point are shown. At the critical point (critical state), the distinction between the liquid and gaseous states disappear and the density of the gaseous substance is equal to that in the liquid state. For every gas this occurs at specific values of temperature and pressure, called critical temperature and critical pressure respectively. At temperatures and pressures above the critical point value, a gas is said be in a supercritical state. Critical constants are evaluated by solving the Vander W aals equation which is a cubic involume. The values are TcIn the supercritical region the behaviour is studied by plotting Z vs P plots. The variation in this region is studied with respect to boyles temperature aAt temperaturehigher than CB the variation is linear (Plot I) and at temperature lower than CB the variation is non linear (Plot II) With reference to the passage answers the following questions:Q.The figure shows the effect of pressure on the compressibility factor, Z of a gas :The wrong conclusion(s) is/are:a)The curve AE can be explained by PV = RTb)The curve AF and CD can be explained by PV = KT + Pbc)The curve AB can be explained by PV = RT -a/Vd)All the three curves AF, AE and AD shows the real behaviourCorrect answer is option 'D'. Can you explain this answer?, a detailed solution for In the Figure, isotherms of CO2 at several temperatures near the critical point are shown. At the critical point (critical state), the distinction between the liquid and gaseous states disappear and the density of the gaseous substance is equal to that in the liquid state. For every gas this occurs at specific values of temperature and pressure, called critical temperature and critical pressure respectively. At temperatures and pressures above the critical point value, a gas is said be in a supercritical state. Critical constants are evaluated by solving the Vander W aals equation which is a cubic involume. The values are TcIn the supercritical region the behaviour is studied by plotting Z vs P plots. The variation in this region is studied with respect to boyles temperature aAt temperaturehigher than CB the variation is linear (Plot I) and at temperature lower than CB the variation is non linear (Plot II) With reference to the passage answers the following questions:Q.The figure shows the effect of pressure on the compressibility factor, Z of a gas :The wrong conclusion(s) is/are:a)The curve AE can be explained by PV = RTb)The curve AF and CD can be explained by PV = KT + Pbc)The curve AB can be explained by PV = RT -a/Vd)All the three curves AF, AE and AD shows the real behaviourCorrect answer is option 'D'. Can you explain this answer? has been provided alongside types of In the Figure, isotherms of CO2 at several temperatures near the critical point are shown. At the critical point (critical state), the distinction between the liquid and gaseous states disappear and the density of the gaseous substance is equal to that in the liquid state. For every gas this occurs at specific values of temperature and pressure, called critical temperature and critical pressure respectively. At temperatures and pressures above the critical point value, a gas is said be in a supercritical state. Critical constants are evaluated by solving the Vander W aals equation which is a cubic involume. The values are TcIn the supercritical region the behaviour is studied by plotting Z vs P plots. The variation in this region is studied with respect to boyles temperature aAt temperaturehigher than CB the variation is linear (Plot I) and at temperature lower than CB the variation is non linear (Plot II) With reference to the passage answers the following questions:Q.The figure shows the effect of pressure on the compressibility factor, Z of a gas :The wrong conclusion(s) is/are:a)The curve AE can be explained by PV = RTb)The curve AF and CD can be explained by PV = KT + Pbc)The curve AB can be explained by PV = RT -a/Vd)All the three curves AF, AE and AD shows the real behaviourCorrect answer is option 'D'. Can you explain this answer? theory, EduRev gives you an
ample number of questions to practice In the Figure, isotherms of CO2 at several temperatures near the critical point are shown. At the critical point (critical state), the distinction between the liquid and gaseous states disappear and the density of the gaseous substance is equal to that in the liquid state. For every gas this occurs at specific values of temperature and pressure, called critical temperature and critical pressure respectively. At temperatures and pressures above the critical point value, a gas is said be in a supercritical state. Critical constants are evaluated by solving the Vander W aals equation which is a cubic involume. The values are TcIn the supercritical region the behaviour is studied by plotting Z vs P plots. The variation in this region is studied with respect to boyles temperature aAt temperaturehigher than CB the variation is linear (Plot I) and at temperature lower than CB the variation is non linear (Plot II) With reference to the passage answers the following questions:Q.The figure shows the effect of pressure on the compressibility factor, Z of a gas :The wrong conclusion(s) is/are:a)The curve AE can be explained by PV = RTb)The curve AF and CD can be explained by PV = KT + Pbc)The curve AB can be explained by PV = RT -a/Vd)All the three curves AF, AE and AD shows the real behaviourCorrect answer is option 'D'. Can you explain this answer? tests, examples and also practice JEE tests.
|
|
Explore Courses for JEE exam
|
|
Suggested Free Tests
Signup for Free!
Signup to see your scores go up within 7 days! Learn & Practice with 1000+ FREE Notes, Videos & Tests.


|
© EduRev
|
Education Revolution
|


|


Signup to see your scores
go up within 7 days!
Access 1000+ FREE Docs, Videos and Tests
Takes less than 10 seconds to signup