


NEET Exam > NEET Questions > Graph between potential ,charge density and e...
Start Learning for Free
Graph between potential ,charge density and electirc field in a p-n junction diode? Can anybody please explain ? How does it came!?

Most Upvoted Answer
Graph between potential ,charge density and electirc field in a p-n ju...
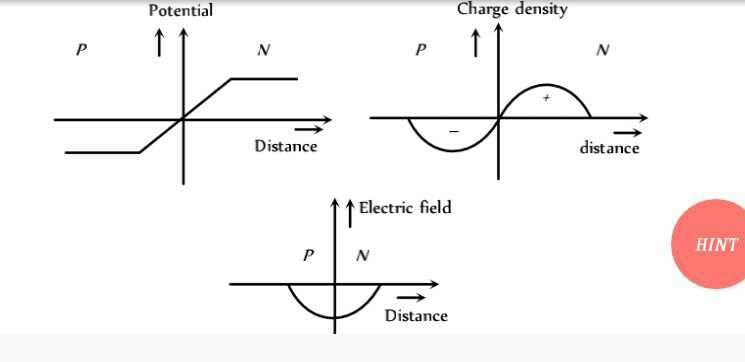
Graph of Potential, Charge Density, and Electric Field in a p-n Junction Diode
A p-n junction diode is a semiconductor device that consists of a p-type semiconductor and an n-type semiconductor. The region where the p-type and n-type semiconductors meet is called the depletion region. The depletion region is a region where there are no free charges. When a voltage is applied across the p-n junction, the depletion region acts as a barrier to the flow of current.
Potential Graph
The potential graph shows the variation of potential across the p-n junction. The potential is negative on the n-type side and positive on the p-type side. The potential barrier is the difference in potential between the two sides of the junction. The potential barrier prevents the flow of current until the external voltage is sufficient to overcome the barrier.
Charge Density Graph
The charge density graph shows the variation of charge density across the p-n junction. The charge density is positive on the p-type side and negative on the n-type side. The depletion region has a charge density of zero. The charge density is highest at the edges of the depletion region.
Electric Field Graph
The electric field graph shows the variation of electric field across the p-n junction. The electric field is directed from the p-type side to the n-type side. The electric field is highest at the edges of the depletion region. The electric field is zero in the depletion region.
Formation of Graph
The potential, charge density, and electric field graphs are related to each other. The potential graph determines the charge density and the electric field. The charge density and electric field are related by the Poisson equation. The Poisson equation relates the charge density to the potential and the electric field to the potential gradient.
Conclusion
The potential, charge density, and electric field graphs are important in understanding the behavior of a p-n junction diode. The potential barrier, charge density, and electric field determine the behavior of the diode. The graphs show the variation of these parameters across the p-n junction. The graphs help in designing and analyzing p-n junction diodes.
Community Answer
Graph between potential ,charge density and electirc field in a p-n ju...

|
Explore Courses for NEET exam
|
|
Similar NEET Doubts


Top Courses for NEETView all


Graph between potential ,charge density and electirc field in a p-n junction diode? Can anybody please explain ? How does it came!?
Question Description
Graph between potential ,charge density and electirc field in a p-n junction diode? Can anybody please explain ? How does it came!? for NEET 2025 is part of NEET preparation. The Question and answers have been prepared according to the NEET exam syllabus. Information about Graph between potential ,charge density and electirc field in a p-n junction diode? Can anybody please explain ? How does it came!? covers all topics & solutions for NEET 2025 Exam. Find important definitions, questions, meanings, examples, exercises and tests below for Graph between potential ,charge density and electirc field in a p-n junction diode? Can anybody please explain ? How does it came!?.
Graph between potential ,charge density and electirc field in a p-n junction diode? Can anybody please explain ? How does it came!? for NEET 2025 is part of NEET preparation. The Question and answers have been prepared according to the NEET exam syllabus. Information about Graph between potential ,charge density and electirc field in a p-n junction diode? Can anybody please explain ? How does it came!? covers all topics & solutions for NEET 2025 Exam. Find important definitions, questions, meanings, examples, exercises and tests below for Graph between potential ,charge density and electirc field in a p-n junction diode? Can anybody please explain ? How does it came!?.
Solutions for Graph between potential ,charge density and electirc field in a p-n junction diode? Can anybody please explain ? How does it came!? in English & in Hindi are available as part of our courses for NEET.
Download more important topics, notes, lectures and mock test series for NEET Exam by signing up for free.
Here you can find the meaning of Graph between potential ,charge density and electirc field in a p-n junction diode? Can anybody please explain ? How does it came!? defined & explained in the simplest way possible. Besides giving the explanation of
Graph between potential ,charge density and electirc field in a p-n junction diode? Can anybody please explain ? How does it came!?, a detailed solution for Graph between potential ,charge density and electirc field in a p-n junction diode? Can anybody please explain ? How does it came!? has been provided alongside types of Graph between potential ,charge density and electirc field in a p-n junction diode? Can anybody please explain ? How does it came!? theory, EduRev gives you an
ample number of questions to practice Graph between potential ,charge density and electirc field in a p-n junction diode? Can anybody please explain ? How does it came!? tests, examples and also practice NEET tests.
|
|
Explore Courses for NEET exam
|
|

Signup to solve all Doubts
Signup to see your scores go up within 7 days! Learn & Practice with 1000+ FREE Notes, Videos & Tests.


|
© EduRev
|
Education Revolution
|


|


Signup to see your scores
go up within 7 days!
Access 1000+ FREE Docs, Videos and Tests
Takes less than 10 seconds to signup