Class 12 Exam > Class 12 Questions > Integration of box 2 sinx within the limit 0 ...
Start Learning for Free
Integration of box 2 sinx within the limit 0 to 2π by graphical method?
Most Upvoted Answer
Integration of box 2 sinx within the limit 0 to 2π by graphical method...
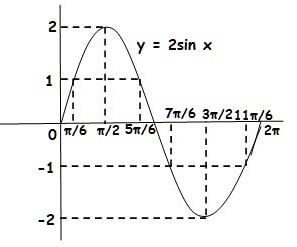
The graph of y = 2 sin x is,


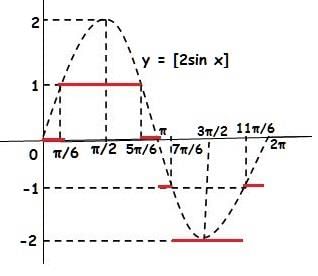
So, the graph of y = [2 sin x], where [.] represents greatest integer function is as given below (the red lines),

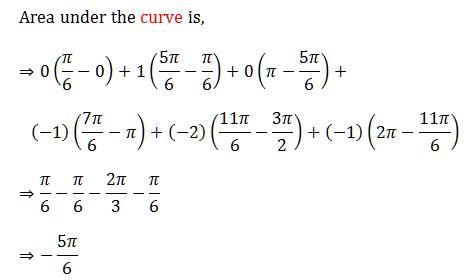
Now the integral of y = [2 sin x] in the required interval is nothing but area under the curve taken along with proper sign. That means area must be taken negative for the region below x-axis.

Note: The second graph is discontinuous at integer values so we must subtract area at integral points, but this area is so less that it can be neglected.Also, the graphs drawn are not to scale.
Community Answer
Integration of box 2 sinx within the limit 0 to 2π by graphical method...
Introduction
Integration is a fundamental concept in calculus, and graphical methods can be used to visualize the process of integration. In this response, we will discuss the integration of box 2 sinx within the limit 0 to 2π using graphical methods.
What is Box 2 sinx?
Box 2 sinx is a periodic function that is defined as follows:
Box 2 sinx = { sinx if 0 ≤ x ≤ π, -sinx if π ≤ x ≤ 2π }
Graphical Representation of Box 2 sinx
To graph Box 2 sinx, we can start by graphing sinx and -sinx separately on the same coordinate plane. We can then join the two graphs at x = π to get the graph of Box 2 sinx. The resulting graph will have two "boxes" with opposite signs, separated by a vertical line at x = π.
Integration of Box 2 sinx
To integrate Box 2 sinx within the limit 0 to 2π, we need to find the area between the graph of Box 2 sinx and the x-axis over the interval [0,2π]. We can do this by breaking up the interval into subintervals and approximating the area using rectangles.
Using Rectangles to Approximate Area
We can start by dividing the interval [0,2π] into n subintervals of equal length. Let Δx be the length of each subinterval, so that Δx = (2π - 0)/n = 2π/n. We can then approximate the area between the graph of Box 2 sinx and the x-axis over each subinterval using a rectangle.
Calculating the Height of Each Rectangle
To calculate the height of each rectangle, we need to find the maximum and minimum values of Box 2 sinx over each subinterval. Since Box 2 sinx has a maximum value of 1 and a minimum value of -1, we can simply use these values to calculate the height of each rectangle.
Summing the Areas of the Rectangles
We can then sum up the areas of the rectangles to get an approximation of the area between the graph of Box 2 sinx and the x-axis over the entire interval [0,2π]. As we increase the number of subintervals, the approximation becomes more accurate.
Conclusion
In conclusion, the integration of Box 2 sinx within the limit 0 to 2π using graphical methods involves graphing Box 2 sinx, breaking up the interval into subintervals, approximating the area using rectangles, calculating the height of each rectangle, and summing up the areas of the rectangles. As we increase the number of subintervals, the approximation becomes more accurate.

|
Explore Courses for Class 12 exam
|

|
Similar Class 12 Doubts
Question Description
Integration of box 2 sinx within the limit 0 to 2π by graphical method? for Class 12 2025 is part of Class 12 preparation. The Question and answers have been prepared according to the Class 12 exam syllabus. Information about Integration of box 2 sinx within the limit 0 to 2π by graphical method? covers all topics & solutions for Class 12 2025 Exam. Find important definitions, questions, meanings, examples, exercises and tests below for Integration of box 2 sinx within the limit 0 to 2π by graphical method?.
Integration of box 2 sinx within the limit 0 to 2π by graphical method? for Class 12 2025 is part of Class 12 preparation. The Question and answers have been prepared according to the Class 12 exam syllabus. Information about Integration of box 2 sinx within the limit 0 to 2π by graphical method? covers all topics & solutions for Class 12 2025 Exam. Find important definitions, questions, meanings, examples, exercises and tests below for Integration of box 2 sinx within the limit 0 to 2π by graphical method?.
Solutions for Integration of box 2 sinx within the limit 0 to 2π by graphical method? in English & in Hindi are available as part of our courses for Class 12.
Download more important topics, notes, lectures and mock test series for Class 12 Exam by signing up for free.
Here you can find the meaning of Integration of box 2 sinx within the limit 0 to 2π by graphical method? defined & explained in the simplest way possible. Besides giving the explanation of
Integration of box 2 sinx within the limit 0 to 2π by graphical method?, a detailed solution for Integration of box 2 sinx within the limit 0 to 2π by graphical method? has been provided alongside types of Integration of box 2 sinx within the limit 0 to 2π by graphical method? theory, EduRev gives you an
ample number of questions to practice Integration of box 2 sinx within the limit 0 to 2π by graphical method? tests, examples and also practice Class 12 tests.

|
Explore Courses for Class 12 exam
|

|
Signup to solve all Doubts
Signup to see your scores go up within 7 days! Learn & Practice with 1000+ FREE Notes, Videos & Tests.


