


Electrical Engineering (EE) Exam > Electrical Engineering (EE) Questions > Polar plot of G(s) =is aa)straight line b)sem... Start Learning for Free
Polar plot of G(s) =  is a
is a
is a- a)straight line
- b)semicircle
- c)parabola
- d)circle
Correct answer is option 'B'. Can you explain this answer?

Verified Answer
Polar plot of G(s) =is aa)straight line b)semicirclec)parabola d)circl...
Given, 
It is a type - 0 and order - 1 system, therefore its polar-plot will be as shown below.
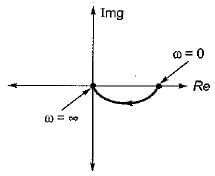
Hence, the polar plot will be semicircular in shape.
It is a type - 0 and order - 1 system, therefore its polar-plot will be as shown below.
Hence, the polar plot will be semicircular in shape.
Most Upvoted Answer
Polar plot of G(s) =is aa)straight line b)semicirclec)parabola d)circl...
Understanding the Polar Plot of G(s) = 1/(1 + Ts)
The transfer function G(s) = 1/(1 + Ts) represents a first-order system. When analyzing this function in the frequency domain, we can create a polar plot that provides insights into the system's stability and response characteristics.
Key Points about the Polar Plot
- Definition of Polar Plot: A polar plot represents the magnitude and phase of a complex function as a function of frequency. For G(s), we substitute s with jω (where ω is the frequency).
- Substituting in G(s):
- G(jω) = 1 / (1 + jTω)
- Magnitude Calculation:
- The magnitude |G(jω)| is calculated as:
- |G(jω)| = 1 / √(1 + (Tω)^2)
- Phase Calculation:
- The phase angle ∠G(jω) is given by:
- ∠G(jω) = -tan^(-1)(Tω)
Shape of the Polar Plot
- Resulting Shape:
- As frequency (ω) increases, the magnitude decreases, forming a semicircular shape on the polar plot.
- The plot starts at 1 (when ω = 0) and approaches 0 as ω goes to infinity.
- Conclusion:
- The semicircle is indicative of a first-order low-pass filter behavior, confirming that the correct answer is option 'B'.
Significance of the Semicircular Shape
- Stability Insight: The semicircular nature of the plot indicates that the system is stable and demonstrates the frequency response characteristics effectively.
- Control Design: Understanding this shape aids in control system design, helping engineers predict system behavior under various input conditions.
In summary, the polar plot of G(s) = 1/(1 + Ts) is indeed a semicircle, reflecting the system's response characteristics.
 | Explore Courses for Electrical Engineering (EE) exam |
Top Courses for Electrical Engineering (EE)View all


Top Courses for Electrical Engineering (EE)
Question Description
Polar plot of G(s) =is aa)straight line b)semicirclec)parabola d)circleCorrect answer is option 'B'. Can you explain this answer? for Electrical Engineering (EE) 2026 is part of Electrical Engineering (EE) preparation. The Question and answers have been prepared according to the Electrical Engineering (EE) exam syllabus. Information about Polar plot of G(s) =is aa)straight line b)semicirclec)parabola d)circleCorrect answer is option 'B'. Can you explain this answer? covers all topics & solutions for Electrical Engineering (EE) 2026 Exam. Find important definitions, questions, meanings, examples, exercises and tests below for Polar plot of G(s) =is aa)straight line b)semicirclec)parabola d)circleCorrect answer is option 'B'. Can you explain this answer?.
Polar plot of G(s) =is aa)straight line b)semicirclec)parabola d)circleCorrect answer is option 'B'. Can you explain this answer? for Electrical Engineering (EE) 2026 is part of Electrical Engineering (EE) preparation. The Question and answers have been prepared according to the Electrical Engineering (EE) exam syllabus. Information about Polar plot of G(s) =is aa)straight line b)semicirclec)parabola d)circleCorrect answer is option 'B'. Can you explain this answer? covers all topics & solutions for Electrical Engineering (EE) 2026 Exam. Find important definitions, questions, meanings, examples, exercises and tests below for Polar plot of G(s) =is aa)straight line b)semicirclec)parabola d)circleCorrect answer is option 'B'. Can you explain this answer?.
Solutions for Polar plot of G(s) =is aa)straight line b)semicirclec)parabola d)circleCorrect answer is option 'B'. Can you explain this answer? in English & in Hindi are available as part of our courses for Electrical Engineering (EE). Download more important topics, notes, lectures and mock test series for Electrical Engineering (EE) Exam by signing up for free.
Here you can find the meaning of Polar plot of G(s) =is aa)straight line b)semicirclec)parabola d)circleCorrect answer is option 'B'. Can you explain this answer? defined & explained in the simplest way possible. Besides giving the explanation of Polar plot of G(s) =is aa)straight line b)semicirclec)parabola d)circleCorrect answer is option 'B'. Can you explain this answer?, a detailed solution for Polar plot of G(s) =is aa)straight line b)semicirclec)parabola d)circleCorrect answer is option 'B'. Can you explain this answer? has been provided alongside types of Polar plot of G(s) =is aa)straight line b)semicirclec)parabola d)circleCorrect answer is option 'B'. Can you explain this answer? theory, EduRev gives you an ample number of questions to practice Polar plot of G(s) =is aa)straight line b)semicirclec)parabola d)circleCorrect answer is option 'B'. Can you explain this answer? tests, examples and also practice Electrical Engineering (EE) tests.
| Explore Courses for Electrical Engineering (EE) exam |
Top Courses for Electrical Engineering (EE)
Explore Courses
Signup for Free!
Signup to see your scores go up within 7 days! Learn & Practice with 1000+ FREE Notes, Videos & Tests.


