


CAT Exam > CAT Questions > Directions for Questions: Answer the question...
Start Learning for Free
Directions for Questions: Answer the questions on the basis of the information given below.
The break-up of the financial budget of a country called Chaupatland for FY 2010-11 is represented by the pie charts given below. Pie chart A represents Budgeted Revenue and pie chart B represents Budgeted Expenditure.
The break-up of the financial budget of a country called Chaupatland for FY 2010-11 is represented by the pie charts given below. Pie chart A represents Budgeted Revenue and pie chart B represents Budgeted Expenditure.
(2010)
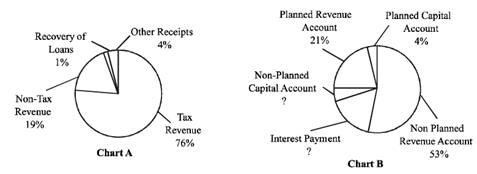
Q. By how much did the sum of Planned Revenue Account and Planned Capital Account exceed Non-Tax Revenue?
- a)₹ 281.25 thousand crores
- b)₹ 236.25 thousand crores
- c)₹ 186.25 thousand crores
- d)₹ 88.25 thousand crores
Correct answer is option 'C'. Can you explain this answer?

Most Upvoted Answer
Directions for Questions: Answer the questions on the basis of the inf...
The sum of Planned Revenue Account and Planned Capital Account (₹ 281.25 thousand crores) exceeded the Non-Tax Revenue (₹ 95 thousand crores) by ₹ 186.25 thousand crores.

|
Explore Courses for CAT exam
|
|
Top Courses for CATView all


Question Description
Directions for Questions: Answer the questions on the basis of the information given below.The break-up of the financial budget of a country called Chaupatland for FY 2010-11 is represented by the pie charts given below. Pie chart A represents Budgeted Revenue and pie chart B represents Budgeted Expenditure.(2010)Q.By how much did the sum of Planned Revenue Account and Planned Capital Account exceed Non-Tax Revenue?a) 281.25 thousand croresb) 236.25 thousand croresc) 186.25 thousand croresd) 88.25 thousand croresCorrect answer is option 'C'. Can you explain this answer? for CAT 2025 is part of CAT preparation. The Question and answers have been prepared according to the CAT exam syllabus. Information about Directions for Questions: Answer the questions on the basis of the information given below.The break-up of the financial budget of a country called Chaupatland for FY 2010-11 is represented by the pie charts given below. Pie chart A represents Budgeted Revenue and pie chart B represents Budgeted Expenditure.(2010)Q.By how much did the sum of Planned Revenue Account and Planned Capital Account exceed Non-Tax Revenue?a) 281.25 thousand croresb) 236.25 thousand croresc) 186.25 thousand croresd) 88.25 thousand croresCorrect answer is option 'C'. Can you explain this answer? covers all topics & solutions for CAT 2025 Exam. Find important definitions, questions, meanings, examples, exercises and tests below for Directions for Questions: Answer the questions on the basis of the information given below.The break-up of the financial budget of a country called Chaupatland for FY 2010-11 is represented by the pie charts given below. Pie chart A represents Budgeted Revenue and pie chart B represents Budgeted Expenditure.(2010)Q.By how much did the sum of Planned Revenue Account and Planned Capital Account exceed Non-Tax Revenue?a) 281.25 thousand croresb) 236.25 thousand croresc) 186.25 thousand croresd) 88.25 thousand croresCorrect answer is option 'C'. Can you explain this answer?.
Directions for Questions: Answer the questions on the basis of the information given below.The break-up of the financial budget of a country called Chaupatland for FY 2010-11 is represented by the pie charts given below. Pie chart A represents Budgeted Revenue and pie chart B represents Budgeted Expenditure.(2010)Q.By how much did the sum of Planned Revenue Account and Planned Capital Account exceed Non-Tax Revenue?a) 281.25 thousand croresb) 236.25 thousand croresc) 186.25 thousand croresd) 88.25 thousand croresCorrect answer is option 'C'. Can you explain this answer? for CAT 2025 is part of CAT preparation. The Question and answers have been prepared according to the CAT exam syllabus. Information about Directions for Questions: Answer the questions on the basis of the information given below.The break-up of the financial budget of a country called Chaupatland for FY 2010-11 is represented by the pie charts given below. Pie chart A represents Budgeted Revenue and pie chart B represents Budgeted Expenditure.(2010)Q.By how much did the sum of Planned Revenue Account and Planned Capital Account exceed Non-Tax Revenue?a) 281.25 thousand croresb) 236.25 thousand croresc) 186.25 thousand croresd) 88.25 thousand croresCorrect answer is option 'C'. Can you explain this answer? covers all topics & solutions for CAT 2025 Exam. Find important definitions, questions, meanings, examples, exercises and tests below for Directions for Questions: Answer the questions on the basis of the information given below.The break-up of the financial budget of a country called Chaupatland for FY 2010-11 is represented by the pie charts given below. Pie chart A represents Budgeted Revenue and pie chart B represents Budgeted Expenditure.(2010)Q.By how much did the sum of Planned Revenue Account and Planned Capital Account exceed Non-Tax Revenue?a) 281.25 thousand croresb) 236.25 thousand croresc) 186.25 thousand croresd) 88.25 thousand croresCorrect answer is option 'C'. Can you explain this answer?.
Solutions for Directions for Questions: Answer the questions on the basis of the information given below.The break-up of the financial budget of a country called Chaupatland for FY 2010-11 is represented by the pie charts given below. Pie chart A represents Budgeted Revenue and pie chart B represents Budgeted Expenditure.(2010)Q.By how much did the sum of Planned Revenue Account and Planned Capital Account exceed Non-Tax Revenue?a) 281.25 thousand croresb) 236.25 thousand croresc) 186.25 thousand croresd) 88.25 thousand croresCorrect answer is option 'C'. Can you explain this answer? in English & in Hindi are available as part of our courses for CAT.
Download more important topics, notes, lectures and mock test series for CAT Exam by signing up for free.
Here you can find the meaning of Directions for Questions: Answer the questions on the basis of the information given below.The break-up of the financial budget of a country called Chaupatland for FY 2010-11 is represented by the pie charts given below. Pie chart A represents Budgeted Revenue and pie chart B represents Budgeted Expenditure.(2010)Q.By how much did the sum of Planned Revenue Account and Planned Capital Account exceed Non-Tax Revenue?a) 281.25 thousand croresb) 236.25 thousand croresc) 186.25 thousand croresd) 88.25 thousand croresCorrect answer is option 'C'. Can you explain this answer? defined & explained in the simplest way possible. Besides giving the explanation of
Directions for Questions: Answer the questions on the basis of the information given below.The break-up of the financial budget of a country called Chaupatland for FY 2010-11 is represented by the pie charts given below. Pie chart A represents Budgeted Revenue and pie chart B represents Budgeted Expenditure.(2010)Q.By how much did the sum of Planned Revenue Account and Planned Capital Account exceed Non-Tax Revenue?a) 281.25 thousand croresb) 236.25 thousand croresc) 186.25 thousand croresd) 88.25 thousand croresCorrect answer is option 'C'. Can you explain this answer?, a detailed solution for Directions for Questions: Answer the questions on the basis of the information given below.The break-up of the financial budget of a country called Chaupatland for FY 2010-11 is represented by the pie charts given below. Pie chart A represents Budgeted Revenue and pie chart B represents Budgeted Expenditure.(2010)Q.By how much did the sum of Planned Revenue Account and Planned Capital Account exceed Non-Tax Revenue?a) 281.25 thousand croresb) 236.25 thousand croresc) 186.25 thousand croresd) 88.25 thousand croresCorrect answer is option 'C'. Can you explain this answer? has been provided alongside types of Directions for Questions: Answer the questions on the basis of the information given below.The break-up of the financial budget of a country called Chaupatland for FY 2010-11 is represented by the pie charts given below. Pie chart A represents Budgeted Revenue and pie chart B represents Budgeted Expenditure.(2010)Q.By how much did the sum of Planned Revenue Account and Planned Capital Account exceed Non-Tax Revenue?a) 281.25 thousand croresb) 236.25 thousand croresc) 186.25 thousand croresd) 88.25 thousand croresCorrect answer is option 'C'. Can you explain this answer? theory, EduRev gives you an
ample number of questions to practice Directions for Questions: Answer the questions on the basis of the information given below.The break-up of the financial budget of a country called Chaupatland for FY 2010-11 is represented by the pie charts given below. Pie chart A represents Budgeted Revenue and pie chart B represents Budgeted Expenditure.(2010)Q.By how much did the sum of Planned Revenue Account and Planned Capital Account exceed Non-Tax Revenue?a) 281.25 thousand croresb) 236.25 thousand croresc) 186.25 thousand croresd) 88.25 thousand croresCorrect answer is option 'C'. Can you explain this answer? tests, examples and also practice CAT tests.
|
|
Explore Courses for CAT exam
|
|

Signup for Free!
Signup to see your scores go up within 7 days! Learn & Practice with 1000+ FREE Notes, Videos & Tests.


|
© EduRev
|
Education Revolution
|


|


Signup to see your scores
go up
within 7 days!
within 7 days!
Takes less than 10 seconds to signup