


CAT Exam > CAT Questions > Directions for Questions:Answer the following...
Start Learning for Free
Directions for Questions: Answer the following questions on the basis of the information given below.
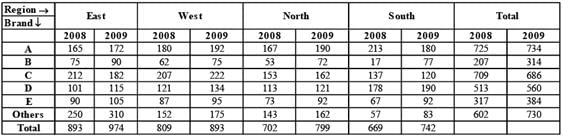
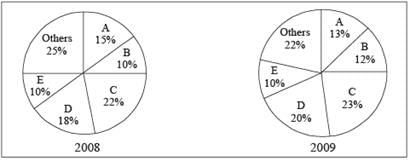
The following table gives the sales turnover (in crore ₹) of the five major detergent brands A, B, C, D, E and others in the 4 regions East, West, North and South of India. The data is for the years 2008 and 2009. The pie chart gives the breakup of the sales of the same brands in terms of the number of units sold. The total number of units sold for 2008 and 2009 was the same.
The following table gives the sales turnover (in crore ₹) of the five major detergent brands A, B, C, D, E and others in the 4 regions East, West, North and South of India. The data is for the years 2008 and 2009. The pie chart gives the breakup of the sales of the same brands in terms of the number of units sold. The total number of units sold for 2008 and 2009 was the same.
(2012)
Volume-wise Breakup of Brands All India
Q. Which brand registered the maximum percentage increase in the price per unit in 2009?
- a)A
- b)B
- c)D
- d)E
Correct answer is option 'B'. Can you explain this answer?

Most Upvoted Answer
Directions for Questions:Answer the following questions on the basis o...
Percentage increase in price per unit in 2009.
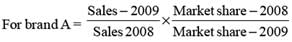 ⇒ 734 / 725 × 15 / 13 = 1.168%
For brand B ⇒ 314 / 207 x 10 / 12 = 1.264%
For brand C ⇒ 686 / 709 x 22 / 23 = 0.925%
For brand D ⇒ 560 / 513 x 18 / 20 = 0.982%
For brand E ⇒ 384 / 317 x 10 / 10 = 1.211%
So, brand B registered the maximum percentage increase in the price per unit in 2009.
⇒ 734 / 725 × 15 / 13 = 1.168%For brand B ⇒ 314 / 207 x 10 / 12 = 1.264%
For brand C ⇒ 686 / 709 x 22 / 23 = 0.925%
For brand D ⇒ 560 / 513 x 18 / 20 = 0.982%
For brand E ⇒ 384 / 317 x 10 / 10 = 1.211%
So, brand B registered the maximum percentage increase in the price per unit in 2009.

|
Explore Courses for CAT exam
|
|
Top Courses for CATView all


Question Description
Directions for Questions:Answer the following questions on the basis of the information given below.The following table gives the sales turnover (in crore ) of the five major detergent brands A, B, C, D, E and others in the 4 regions East, West, North and South of India. The data is for the years 2008 and 2009. The pie chart gives the breakup of the sales of the same brands in terms of the number of units sold. The total number of units sold for 2008 and 2009 was the same.(2012)Volume-wise Breakup of Brands All IndiaQ.Which brand registered the maximum percentage increase in the price per unit in 2009?a)Ab)Bc)Dd)ECorrect answer is option 'B'. Can you explain this answer? for CAT 2025 is part of CAT preparation. The Question and answers have been prepared according to the CAT exam syllabus. Information about Directions for Questions:Answer the following questions on the basis of the information given below.The following table gives the sales turnover (in crore ) of the five major detergent brands A, B, C, D, E and others in the 4 regions East, West, North and South of India. The data is for the years 2008 and 2009. The pie chart gives the breakup of the sales of the same brands in terms of the number of units sold. The total number of units sold for 2008 and 2009 was the same.(2012)Volume-wise Breakup of Brands All IndiaQ.Which brand registered the maximum percentage increase in the price per unit in 2009?a)Ab)Bc)Dd)ECorrect answer is option 'B'. Can you explain this answer? covers all topics & solutions for CAT 2025 Exam. Find important definitions, questions, meanings, examples, exercises and tests below for Directions for Questions:Answer the following questions on the basis of the information given below.The following table gives the sales turnover (in crore ) of the five major detergent brands A, B, C, D, E and others in the 4 regions East, West, North and South of India. The data is for the years 2008 and 2009. The pie chart gives the breakup of the sales of the same brands in terms of the number of units sold. The total number of units sold for 2008 and 2009 was the same.(2012)Volume-wise Breakup of Brands All IndiaQ.Which brand registered the maximum percentage increase in the price per unit in 2009?a)Ab)Bc)Dd)ECorrect answer is option 'B'. Can you explain this answer?.
Directions for Questions:Answer the following questions on the basis of the information given below.The following table gives the sales turnover (in crore ) of the five major detergent brands A, B, C, D, E and others in the 4 regions East, West, North and South of India. The data is for the years 2008 and 2009. The pie chart gives the breakup of the sales of the same brands in terms of the number of units sold. The total number of units sold for 2008 and 2009 was the same.(2012)Volume-wise Breakup of Brands All IndiaQ.Which brand registered the maximum percentage increase in the price per unit in 2009?a)Ab)Bc)Dd)ECorrect answer is option 'B'. Can you explain this answer? for CAT 2025 is part of CAT preparation. The Question and answers have been prepared according to the CAT exam syllabus. Information about Directions for Questions:Answer the following questions on the basis of the information given below.The following table gives the sales turnover (in crore ) of the five major detergent brands A, B, C, D, E and others in the 4 regions East, West, North and South of India. The data is for the years 2008 and 2009. The pie chart gives the breakup of the sales of the same brands in terms of the number of units sold. The total number of units sold for 2008 and 2009 was the same.(2012)Volume-wise Breakup of Brands All IndiaQ.Which brand registered the maximum percentage increase in the price per unit in 2009?a)Ab)Bc)Dd)ECorrect answer is option 'B'. Can you explain this answer? covers all topics & solutions for CAT 2025 Exam. Find important definitions, questions, meanings, examples, exercises and tests below for Directions for Questions:Answer the following questions on the basis of the information given below.The following table gives the sales turnover (in crore ) of the five major detergent brands A, B, C, D, E and others in the 4 regions East, West, North and South of India. The data is for the years 2008 and 2009. The pie chart gives the breakup of the sales of the same brands in terms of the number of units sold. The total number of units sold for 2008 and 2009 was the same.(2012)Volume-wise Breakup of Brands All IndiaQ.Which brand registered the maximum percentage increase in the price per unit in 2009?a)Ab)Bc)Dd)ECorrect answer is option 'B'. Can you explain this answer?.
Solutions for Directions for Questions:Answer the following questions on the basis of the information given below.The following table gives the sales turnover (in crore ) of the five major detergent brands A, B, C, D, E and others in the 4 regions East, West, North and South of India. The data is for the years 2008 and 2009. The pie chart gives the breakup of the sales of the same brands in terms of the number of units sold. The total number of units sold for 2008 and 2009 was the same.(2012)Volume-wise Breakup of Brands All IndiaQ.Which brand registered the maximum percentage increase in the price per unit in 2009?a)Ab)Bc)Dd)ECorrect answer is option 'B'. Can you explain this answer? in English & in Hindi are available as part of our courses for CAT.
Download more important topics, notes, lectures and mock test series for CAT Exam by signing up for free.
Here you can find the meaning of Directions for Questions:Answer the following questions on the basis of the information given below.The following table gives the sales turnover (in crore ) of the five major detergent brands A, B, C, D, E and others in the 4 regions East, West, North and South of India. The data is for the years 2008 and 2009. The pie chart gives the breakup of the sales of the same brands in terms of the number of units sold. The total number of units sold for 2008 and 2009 was the same.(2012)Volume-wise Breakup of Brands All IndiaQ.Which brand registered the maximum percentage increase in the price per unit in 2009?a)Ab)Bc)Dd)ECorrect answer is option 'B'. Can you explain this answer? defined & explained in the simplest way possible. Besides giving the explanation of
Directions for Questions:Answer the following questions on the basis of the information given below.The following table gives the sales turnover (in crore ) of the five major detergent brands A, B, C, D, E and others in the 4 regions East, West, North and South of India. The data is for the years 2008 and 2009. The pie chart gives the breakup of the sales of the same brands in terms of the number of units sold. The total number of units sold for 2008 and 2009 was the same.(2012)Volume-wise Breakup of Brands All IndiaQ.Which brand registered the maximum percentage increase in the price per unit in 2009?a)Ab)Bc)Dd)ECorrect answer is option 'B'. Can you explain this answer?, a detailed solution for Directions for Questions:Answer the following questions on the basis of the information given below.The following table gives the sales turnover (in crore ) of the five major detergent brands A, B, C, D, E and others in the 4 regions East, West, North and South of India. The data is for the years 2008 and 2009. The pie chart gives the breakup of the sales of the same brands in terms of the number of units sold. The total number of units sold for 2008 and 2009 was the same.(2012)Volume-wise Breakup of Brands All IndiaQ.Which brand registered the maximum percentage increase in the price per unit in 2009?a)Ab)Bc)Dd)ECorrect answer is option 'B'. Can you explain this answer? has been provided alongside types of Directions for Questions:Answer the following questions on the basis of the information given below.The following table gives the sales turnover (in crore ) of the five major detergent brands A, B, C, D, E and others in the 4 regions East, West, North and South of India. The data is for the years 2008 and 2009. The pie chart gives the breakup of the sales of the same brands in terms of the number of units sold. The total number of units sold for 2008 and 2009 was the same.(2012)Volume-wise Breakup of Brands All IndiaQ.Which brand registered the maximum percentage increase in the price per unit in 2009?a)Ab)Bc)Dd)ECorrect answer is option 'B'. Can you explain this answer? theory, EduRev gives you an
ample number of questions to practice Directions for Questions:Answer the following questions on the basis of the information given below.The following table gives the sales turnover (in crore ) of the five major detergent brands A, B, C, D, E and others in the 4 regions East, West, North and South of India. The data is for the years 2008 and 2009. The pie chart gives the breakup of the sales of the same brands in terms of the number of units sold. The total number of units sold for 2008 and 2009 was the same.(2012)Volume-wise Breakup of Brands All IndiaQ.Which brand registered the maximum percentage increase in the price per unit in 2009?a)Ab)Bc)Dd)ECorrect answer is option 'B'. Can you explain this answer? tests, examples and also practice CAT tests.
|
|
Explore Courses for CAT exam
|
|

Signup for Free!
Signup to see your scores go up within 7 days! Learn & Practice with 1000+ FREE Notes, Videos & Tests.
|
© EduRev
|
Education Revolution
|


|


Signup to see your scores
go up within 7 days!
Access 1000+ FREE Docs, Videos and Tests
Takes less than 10 seconds to signup