


Class 4 Exam > Class 4 Questions > Direction: given line graph represents the nu...
Start Learning for Free
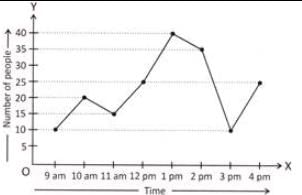
Direction: given line graph represents the number of people in a store since its opening till closing at various times of a day
Study the line graph and answer the questions given below:
How many people were there at the store between 1 pm to 2 pm?
- a)45 to 50
- b)25 to 30
- c)50 to 55
- d)35 to 40
Correct answer is option 'D'. Can you explain this answer?

Most Upvoted Answer
Direction: given line graph represents the number of people in a store...
Option (d) is correct. Here, two dots representing 1 pm and 2 pm one at the points 40 and 35 respectively. Therefore, there were 35 to 40 people at the store in between 1 pm to 2 pm.

|
Explore Courses for Class 4 exam
|
|
Top Courses for Class 4View all


Question Description
Direction: given line graph represents the number of people in a store since its opening till closing at various times of a dayStudy the line graph and answer the questions given below:How many people were there at the store between 1 pm to 2 pm?a)45 to 50b)25 to 30c)50 to 55d)35 to 40Correct answer is option 'D'. Can you explain this answer? for Class 4 2025 is part of Class 4 preparation. The Question and answers have been prepared according to the Class 4 exam syllabus. Information about Direction: given line graph represents the number of people in a store since its opening till closing at various times of a dayStudy the line graph and answer the questions given below:How many people were there at the store between 1 pm to 2 pm?a)45 to 50b)25 to 30c)50 to 55d)35 to 40Correct answer is option 'D'. Can you explain this answer? covers all topics & solutions for Class 4 2025 Exam. Find important definitions, questions, meanings, examples, exercises and tests below for Direction: given line graph represents the number of people in a store since its opening till closing at various times of a dayStudy the line graph and answer the questions given below:How many people were there at the store between 1 pm to 2 pm?a)45 to 50b)25 to 30c)50 to 55d)35 to 40Correct answer is option 'D'. Can you explain this answer?.
Direction: given line graph represents the number of people in a store since its opening till closing at various times of a dayStudy the line graph and answer the questions given below:How many people were there at the store between 1 pm to 2 pm?a)45 to 50b)25 to 30c)50 to 55d)35 to 40Correct answer is option 'D'. Can you explain this answer? for Class 4 2025 is part of Class 4 preparation. The Question and answers have been prepared according to the Class 4 exam syllabus. Information about Direction: given line graph represents the number of people in a store since its opening till closing at various times of a dayStudy the line graph and answer the questions given below:How many people were there at the store between 1 pm to 2 pm?a)45 to 50b)25 to 30c)50 to 55d)35 to 40Correct answer is option 'D'. Can you explain this answer? covers all topics & solutions for Class 4 2025 Exam. Find important definitions, questions, meanings, examples, exercises and tests below for Direction: given line graph represents the number of people in a store since its opening till closing at various times of a dayStudy the line graph and answer the questions given below:How many people were there at the store between 1 pm to 2 pm?a)45 to 50b)25 to 30c)50 to 55d)35 to 40Correct answer is option 'D'. Can you explain this answer?.
Solutions for Direction: given line graph represents the number of people in a store since its opening till closing at various times of a dayStudy the line graph and answer the questions given below:How many people were there at the store between 1 pm to 2 pm?a)45 to 50b)25 to 30c)50 to 55d)35 to 40Correct answer is option 'D'. Can you explain this answer? in English & in Hindi are available as part of our courses for Class 4.
Download more important topics, notes, lectures and mock test series for Class 4 Exam by signing up for free.
Here you can find the meaning of Direction: given line graph represents the number of people in a store since its opening till closing at various times of a dayStudy the line graph and answer the questions given below:How many people were there at the store between 1 pm to 2 pm?a)45 to 50b)25 to 30c)50 to 55d)35 to 40Correct answer is option 'D'. Can you explain this answer? defined & explained in the simplest way possible. Besides giving the explanation of
Direction: given line graph represents the number of people in a store since its opening till closing at various times of a dayStudy the line graph and answer the questions given below:How many people were there at the store between 1 pm to 2 pm?a)45 to 50b)25 to 30c)50 to 55d)35 to 40Correct answer is option 'D'. Can you explain this answer?, a detailed solution for Direction: given line graph represents the number of people in a store since its opening till closing at various times of a dayStudy the line graph and answer the questions given below:How many people were there at the store between 1 pm to 2 pm?a)45 to 50b)25 to 30c)50 to 55d)35 to 40Correct answer is option 'D'. Can you explain this answer? has been provided alongside types of Direction: given line graph represents the number of people in a store since its opening till closing at various times of a dayStudy the line graph and answer the questions given below:How many people were there at the store between 1 pm to 2 pm?a)45 to 50b)25 to 30c)50 to 55d)35 to 40Correct answer is option 'D'. Can you explain this answer? theory, EduRev gives you an
ample number of questions to practice Direction: given line graph represents the number of people in a store since its opening till closing at various times of a dayStudy the line graph and answer the questions given below:How many people were there at the store between 1 pm to 2 pm?a)45 to 50b)25 to 30c)50 to 55d)35 to 40Correct answer is option 'D'. Can you explain this answer? tests, examples and also practice Class 4 tests.
|
|
Explore Courses for Class 4 exam
|
|

Signup for Free!
Signup to see your scores go up within 7 days! Learn & Practice with 1000+ FREE Notes, Videos & Tests.
|
© EduRev
|
Education Revolution
|


|


Signup to see your scores
go up within 7 days!
Access 1000+ FREE Docs, Videos and Tests
Takes less than 10 seconds to signup