


Class 12 Exam > Class 12 Questions > In the V-I graph for a given metallic wire at...
Start Learning for Free
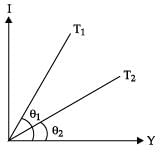
In the V-I graph for a given metallic wire at two different temperatures T1 and T2 are shown in figure. The relationship between T1 and T2 is
- a)T1 = T2
- b)T1 ∠ T2
- c)T1 > T2
- d)none of these
Correct answer is option 'C'. Can you explain this answer?

Most Upvoted Answer
In the V-I graph for a given metallic wire at two different temperatur...
Given figure shows that slope of the line corresponding to T1 is greater than the slope of the line at T2, i.e., tan θ1 > tan θ2, which indicates that T1 > T2.

|
Explore Courses for Class 12 exam
|
|
Top Courses for Class 12View all


Question Description
In the V-I graph for a given metallic wire at two different temperatures T1 and T2 are shown in figure. The relationship between T1 and T2 isa)T1 = T2b)T1 ∠ T2c)T1 > T2d)none of theseCorrect answer is option 'C'. Can you explain this answer? for Class 12 2025 is part of Class 12 preparation. The Question and answers have been prepared according to the Class 12 exam syllabus. Information about In the V-I graph for a given metallic wire at two different temperatures T1 and T2 are shown in figure. The relationship between T1 and T2 isa)T1 = T2b)T1 ∠ T2c)T1 > T2d)none of theseCorrect answer is option 'C'. Can you explain this answer? covers all topics & solutions for Class 12 2025 Exam. Find important definitions, questions, meanings, examples, exercises and tests below for In the V-I graph for a given metallic wire at two different temperatures T1 and T2 are shown in figure. The relationship between T1 and T2 isa)T1 = T2b)T1 ∠ T2c)T1 > T2d)none of theseCorrect answer is option 'C'. Can you explain this answer?.
In the V-I graph for a given metallic wire at two different temperatures T1 and T2 are shown in figure. The relationship between T1 and T2 isa)T1 = T2b)T1 ∠ T2c)T1 > T2d)none of theseCorrect answer is option 'C'. Can you explain this answer? for Class 12 2025 is part of Class 12 preparation. The Question and answers have been prepared according to the Class 12 exam syllabus. Information about In the V-I graph for a given metallic wire at two different temperatures T1 and T2 are shown in figure. The relationship between T1 and T2 isa)T1 = T2b)T1 ∠ T2c)T1 > T2d)none of theseCorrect answer is option 'C'. Can you explain this answer? covers all topics & solutions for Class 12 2025 Exam. Find important definitions, questions, meanings, examples, exercises and tests below for In the V-I graph for a given metallic wire at two different temperatures T1 and T2 are shown in figure. The relationship between T1 and T2 isa)T1 = T2b)T1 ∠ T2c)T1 > T2d)none of theseCorrect answer is option 'C'. Can you explain this answer?.
Solutions for In the V-I graph for a given metallic wire at two different temperatures T1 and T2 are shown in figure. The relationship between T1 and T2 isa)T1 = T2b)T1 ∠ T2c)T1 > T2d)none of theseCorrect answer is option 'C'. Can you explain this answer? in English & in Hindi are available as part of our courses for Class 12.
Download more important topics, notes, lectures and mock test series for Class 12 Exam by signing up for free.
Here you can find the meaning of In the V-I graph for a given metallic wire at two different temperatures T1 and T2 are shown in figure. The relationship between T1 and T2 isa)T1 = T2b)T1 ∠ T2c)T1 > T2d)none of theseCorrect answer is option 'C'. Can you explain this answer? defined & explained in the simplest way possible. Besides giving the explanation of
In the V-I graph for a given metallic wire at two different temperatures T1 and T2 are shown in figure. The relationship between T1 and T2 isa)T1 = T2b)T1 ∠ T2c)T1 > T2d)none of theseCorrect answer is option 'C'. Can you explain this answer?, a detailed solution for In the V-I graph for a given metallic wire at two different temperatures T1 and T2 are shown in figure. The relationship between T1 and T2 isa)T1 = T2b)T1 ∠ T2c)T1 > T2d)none of theseCorrect answer is option 'C'. Can you explain this answer? has been provided alongside types of In the V-I graph for a given metallic wire at two different temperatures T1 and T2 are shown in figure. The relationship between T1 and T2 isa)T1 = T2b)T1 ∠ T2c)T1 > T2d)none of theseCorrect answer is option 'C'. Can you explain this answer? theory, EduRev gives you an
ample number of questions to practice In the V-I graph for a given metallic wire at two different temperatures T1 and T2 are shown in figure. The relationship between T1 and T2 isa)T1 = T2b)T1 ∠ T2c)T1 > T2d)none of theseCorrect answer is option 'C'. Can you explain this answer? tests, examples and also practice Class 12 tests.
|
|
Explore Courses for Class 12 exam
|
|

Signup for Free!
Signup to see your scores go up within 7 days! Learn & Practice with 1000+ FREE Notes, Videos & Tests.
|
© EduRev
|
Education Revolution
|


|


Signup to see your scores
go up within 7 days!
Access 1000+ FREE Docs, Videos and Tests
Takes less than 10 seconds to signup