


Figure shows the velocity time graph of a par...
Start Learning for Free
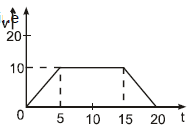
Figure shows the velocity time graph of a particle moving along straight line (v is m/s and t is in seconds). Its average velocity in 20 seconds will be :
- a)10 m/s
- b)zero
- c)3.75 m/s
- d)7.5 m/s
Correct answer is option 'D'. Can you explain this answer?

Most Upvoted Answer
Figure shows the velocity time graph of a particle moving along straig...
Average velocity is given by : Area under the v-t graph / Time So,
Area under the v-t graph= 1/2 (10+20) × 10
= 150m/s^
Time =20s
Then Average velocity= 150/20
= 7.5m/s
SOLVED
Area under the v-t graph= 1/2 (10+20) × 10
= 150m/s^
Time =20s
Then Average velocity= 150/20
= 7.5m/s
SOLVED
|
|
Explore Courses for exam
|
|
Question Description
Figure shows the velocity time graph of a particle moving along straight line (v is m/s and t is in seconds). Its average velocity in 20 seconds will be :a)10 m/sb)zeroc)3.75 m/sd)7.5 m/sCorrect answer is option 'D'. Can you explain this answer? for 2025 is part of preparation. The Question and answers have been prepared according to the exam syllabus. Information about Figure shows the velocity time graph of a particle moving along straight line (v is m/s and t is in seconds). Its average velocity in 20 seconds will be :a)10 m/sb)zeroc)3.75 m/sd)7.5 m/sCorrect answer is option 'D'. Can you explain this answer? covers all topics & solutions for 2025 Exam. Find important definitions, questions, meanings, examples, exercises and tests below for Figure shows the velocity time graph of a particle moving along straight line (v is m/s and t is in seconds). Its average velocity in 20 seconds will be :a)10 m/sb)zeroc)3.75 m/sd)7.5 m/sCorrect answer is option 'D'. Can you explain this answer?.
Figure shows the velocity time graph of a particle moving along straight line (v is m/s and t is in seconds). Its average velocity in 20 seconds will be :a)10 m/sb)zeroc)3.75 m/sd)7.5 m/sCorrect answer is option 'D'. Can you explain this answer? for 2025 is part of preparation. The Question and answers have been prepared according to the exam syllabus. Information about Figure shows the velocity time graph of a particle moving along straight line (v is m/s and t is in seconds). Its average velocity in 20 seconds will be :a)10 m/sb)zeroc)3.75 m/sd)7.5 m/sCorrect answer is option 'D'. Can you explain this answer? covers all topics & solutions for 2025 Exam. Find important definitions, questions, meanings, examples, exercises and tests below for Figure shows the velocity time graph of a particle moving along straight line (v is m/s and t is in seconds). Its average velocity in 20 seconds will be :a)10 m/sb)zeroc)3.75 m/sd)7.5 m/sCorrect answer is option 'D'. Can you explain this answer?.
Solutions for Figure shows the velocity time graph of a particle moving along straight line (v is m/s and t is in seconds). Its average velocity in 20 seconds will be :a)10 m/sb)zeroc)3.75 m/sd)7.5 m/sCorrect answer is option 'D'. Can you explain this answer? in English & in Hindi are available as part of our courses for .
Download more important topics, notes, lectures and mock test series for Exam by signing up for free.
Here you can find the meaning of Figure shows the velocity time graph of a particle moving along straight line (v is m/s and t is in seconds). Its average velocity in 20 seconds will be :a)10 m/sb)zeroc)3.75 m/sd)7.5 m/sCorrect answer is option 'D'. Can you explain this answer? defined & explained in the simplest way possible. Besides giving the explanation of
Figure shows the velocity time graph of a particle moving along straight line (v is m/s and t is in seconds). Its average velocity in 20 seconds will be :a)10 m/sb)zeroc)3.75 m/sd)7.5 m/sCorrect answer is option 'D'. Can you explain this answer?, a detailed solution for Figure shows the velocity time graph of a particle moving along straight line (v is m/s and t is in seconds). Its average velocity in 20 seconds will be :a)10 m/sb)zeroc)3.75 m/sd)7.5 m/sCorrect answer is option 'D'. Can you explain this answer? has been provided alongside types of Figure shows the velocity time graph of a particle moving along straight line (v is m/s and t is in seconds). Its average velocity in 20 seconds will be :a)10 m/sb)zeroc)3.75 m/sd)7.5 m/sCorrect answer is option 'D'. Can you explain this answer? theory, EduRev gives you an
ample number of questions to practice Figure shows the velocity time graph of a particle moving along straight line (v is m/s and t is in seconds). Its average velocity in 20 seconds will be :a)10 m/sb)zeroc)3.75 m/sd)7.5 m/sCorrect answer is option 'D'. Can you explain this answer? tests, examples and also practice tests.
|
|
Explore Courses for exam
|
|

Signup for Free!
Signup to see your scores go up within 7 days! Learn & Practice with 1000+ FREE Notes, Videos & Tests.
|
© EduRev
|
Education Revolution
|


|


Signup to see your scores
go up
within 7 days!
within 7 days!
Takes less than 10 seconds to signup