


SAT Exam > SAT Questions > The figure on the left above shows a wheel wi...
Start Learning for Free
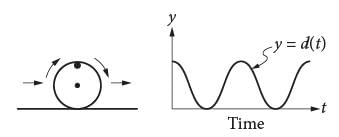
The figure on the left above shows a wheel with a mark on its rim. The wheel is rolling on the ground at a constant rate along a level straight path from a starting point to an ending point. The graph of y = d(t) on the right could represent which of the following as a function of time from when the wheel began to roll?
- a)The speed at which the wheel is rolling
- b)The distance of the wheel from its starting point
- c)The distance of the mark on the rim from the center of the wheel
- d)The distance of the mark on the rim from the ground
Correct answer is option 'D'. Can you explain this answer?

Verified Answer
The figure on the left above shows a wheel with a mark on its rim. The...
The graph on the right shows the change in distance from the ground of the mark on the rim over time. The y-intercept of the graph corresponds to the mark’s position at the start of the motion (t = 0); at this moment, the mark is at its highest point from the ground. As the wheel rolls, the mark approaches the ground, its distance from the ground decreasing until it reaches 0—the point where it touches the ground. After that, the mark moves up and away from the ground, its distance from the ground increasing until it reaches its maximum height from the ground. This is the moment when the wheel has completed a full rotation. The remaining part of the graph shows the distance of the mark from the ground during the second rotation of the wheel. Therefore, of the given choices, only choice D is in agreement with the given information.
Choice A is incorrect because the speed at which the wheel is rolling does not change over time, meaning the graph representing the speed would be a horizontal line. Choice B is incorrect because the distance of the wheel from its starting point to its ending point increases continuously; the graph shows a quantity that changes periodically over time, alternately decreasing and increasing. Choice C is incorrect because the distance of the mark from the center of the wheel is constant and equals the radius of the wheel. The graph representing this distance would be a horizontal line, not the curved line of the graph shown.
Choice A is incorrect because the speed at which the wheel is rolling does not change over time, meaning the graph representing the speed would be a horizontal line. Choice B is incorrect because the distance of the wheel from its starting point to its ending point increases continuously; the graph shows a quantity that changes periodically over time, alternately decreasing and increasing. Choice C is incorrect because the distance of the mark from the center of the wheel is constant and equals the radius of the wheel. The graph representing this distance would be a horizontal line, not the curved line of the graph shown.
Most Upvoted Answer
The figure on the left above shows a wheel with a mark on its rim. The...
The graph on the right shows the change in distance from the ground of the mark on the rim over time. The y-intercept of the graph corresponds to the mark’s position at the start of the motion (t = 0); at this moment, the mark is at its highest point from the ground. As the wheel rolls, the mark approaches the ground, its distance from the ground decreasing until it reaches 0—the point where it touches the ground. After that, the mark moves up and away from the ground, its distance from the ground increasing until it reaches its maximum height from the ground. This is the moment when the wheel has completed a full rotation. The remaining part of the graph shows the distance of the mark from the ground during the second rotation of the wheel. Therefore, of the given choices, only choice D is in agreement with the given information.
Choice A is incorrect because the speed at which the wheel is rolling does not change over time, meaning the graph representing the speed would be a horizontal line. Choice B is incorrect because the distance of the wheel from its starting point to its ending point increases continuously; the graph shows a quantity that changes periodically over time, alternately decreasing and increasing. Choice C is incorrect because the distance of the mark from the center of the wheel is constant and equals the radius of the wheel. The graph representing this distance would be a horizontal line, not the curved line of the graph shown.
Choice A is incorrect because the speed at which the wheel is rolling does not change over time, meaning the graph representing the speed would be a horizontal line. Choice B is incorrect because the distance of the wheel from its starting point to its ending point increases continuously; the graph shows a quantity that changes periodically over time, alternately decreasing and increasing. Choice C is incorrect because the distance of the mark from the center of the wheel is constant and equals the radius of the wheel. The graph representing this distance would be a horizontal line, not the curved line of the graph shown.

|
Explore Courses for SAT exam
|
|
Top Courses for SATView all


Question Description
The figure on the left above shows a wheel with a mark on its rim. The wheel is rolling on the ground at a constant rate along a level straight path from a starting point to an ending point. The graph of y = d(t) on the right could represent which of the following as a function of time from when the wheel began to roll?a)The speed at which the wheel is rollingb)The distance of the wheel from its starting pointc)The distance of the mark on the rim from the center of the wheeld)The distance of the mark on the rim from the groundCorrect answer is option 'D'. Can you explain this answer? for SAT 2025 is part of SAT preparation. The Question and answers have been prepared according to the SAT exam syllabus. Information about The figure on the left above shows a wheel with a mark on its rim. The wheel is rolling on the ground at a constant rate along a level straight path from a starting point to an ending point. The graph of y = d(t) on the right could represent which of the following as a function of time from when the wheel began to roll?a)The speed at which the wheel is rollingb)The distance of the wheel from its starting pointc)The distance of the mark on the rim from the center of the wheeld)The distance of the mark on the rim from the groundCorrect answer is option 'D'. Can you explain this answer? covers all topics & solutions for SAT 2025 Exam. Find important definitions, questions, meanings, examples, exercises and tests below for The figure on the left above shows a wheel with a mark on its rim. The wheel is rolling on the ground at a constant rate along a level straight path from a starting point to an ending point. The graph of y = d(t) on the right could represent which of the following as a function of time from when the wheel began to roll?a)The speed at which the wheel is rollingb)The distance of the wheel from its starting pointc)The distance of the mark on the rim from the center of the wheeld)The distance of the mark on the rim from the groundCorrect answer is option 'D'. Can you explain this answer?.
The figure on the left above shows a wheel with a mark on its rim. The wheel is rolling on the ground at a constant rate along a level straight path from a starting point to an ending point. The graph of y = d(t) on the right could represent which of the following as a function of time from when the wheel began to roll?a)The speed at which the wheel is rollingb)The distance of the wheel from its starting pointc)The distance of the mark on the rim from the center of the wheeld)The distance of the mark on the rim from the groundCorrect answer is option 'D'. Can you explain this answer? for SAT 2025 is part of SAT preparation. The Question and answers have been prepared according to the SAT exam syllabus. Information about The figure on the left above shows a wheel with a mark on its rim. The wheel is rolling on the ground at a constant rate along a level straight path from a starting point to an ending point. The graph of y = d(t) on the right could represent which of the following as a function of time from when the wheel began to roll?a)The speed at which the wheel is rollingb)The distance of the wheel from its starting pointc)The distance of the mark on the rim from the center of the wheeld)The distance of the mark on the rim from the groundCorrect answer is option 'D'. Can you explain this answer? covers all topics & solutions for SAT 2025 Exam. Find important definitions, questions, meanings, examples, exercises and tests below for The figure on the left above shows a wheel with a mark on its rim. The wheel is rolling on the ground at a constant rate along a level straight path from a starting point to an ending point. The graph of y = d(t) on the right could represent which of the following as a function of time from when the wheel began to roll?a)The speed at which the wheel is rollingb)The distance of the wheel from its starting pointc)The distance of the mark on the rim from the center of the wheeld)The distance of the mark on the rim from the groundCorrect answer is option 'D'. Can you explain this answer?.
Solutions for The figure on the left above shows a wheel with a mark on its rim. The wheel is rolling on the ground at a constant rate along a level straight path from a starting point to an ending point. The graph of y = d(t) on the right could represent which of the following as a function of time from when the wheel began to roll?a)The speed at which the wheel is rollingb)The distance of the wheel from its starting pointc)The distance of the mark on the rim from the center of the wheeld)The distance of the mark on the rim from the groundCorrect answer is option 'D'. Can you explain this answer? in English & in Hindi are available as part of our courses for SAT.
Download more important topics, notes, lectures and mock test series for SAT Exam by signing up for free.
Here you can find the meaning of The figure on the left above shows a wheel with a mark on its rim. The wheel is rolling on the ground at a constant rate along a level straight path from a starting point to an ending point. The graph of y = d(t) on the right could represent which of the following as a function of time from when the wheel began to roll?a)The speed at which the wheel is rollingb)The distance of the wheel from its starting pointc)The distance of the mark on the rim from the center of the wheeld)The distance of the mark on the rim from the groundCorrect answer is option 'D'. Can you explain this answer? defined & explained in the simplest way possible. Besides giving the explanation of
The figure on the left above shows a wheel with a mark on its rim. The wheel is rolling on the ground at a constant rate along a level straight path from a starting point to an ending point. The graph of y = d(t) on the right could represent which of the following as a function of time from when the wheel began to roll?a)The speed at which the wheel is rollingb)The distance of the wheel from its starting pointc)The distance of the mark on the rim from the center of the wheeld)The distance of the mark on the rim from the groundCorrect answer is option 'D'. Can you explain this answer?, a detailed solution for The figure on the left above shows a wheel with a mark on its rim. The wheel is rolling on the ground at a constant rate along a level straight path from a starting point to an ending point. The graph of y = d(t) on the right could represent which of the following as a function of time from when the wheel began to roll?a)The speed at which the wheel is rollingb)The distance of the wheel from its starting pointc)The distance of the mark on the rim from the center of the wheeld)The distance of the mark on the rim from the groundCorrect answer is option 'D'. Can you explain this answer? has been provided alongside types of The figure on the left above shows a wheel with a mark on its rim. The wheel is rolling on the ground at a constant rate along a level straight path from a starting point to an ending point. The graph of y = d(t) on the right could represent which of the following as a function of time from when the wheel began to roll?a)The speed at which the wheel is rollingb)The distance of the wheel from its starting pointc)The distance of the mark on the rim from the center of the wheeld)The distance of the mark on the rim from the groundCorrect answer is option 'D'. Can you explain this answer? theory, EduRev gives you an
ample number of questions to practice The figure on the left above shows a wheel with a mark on its rim. The wheel is rolling on the ground at a constant rate along a level straight path from a starting point to an ending point. The graph of y = d(t) on the right could represent which of the following as a function of time from when the wheel began to roll?a)The speed at which the wheel is rollingb)The distance of the wheel from its starting pointc)The distance of the mark on the rim from the center of the wheeld)The distance of the mark on the rim from the groundCorrect answer is option 'D'. Can you explain this answer? tests, examples and also practice SAT tests.
|
|
Explore Courses for SAT exam
|
|

Signup for Free!
Signup to see your scores go up within 7 days! Learn & Practice with 1000+ FREE Notes, Videos & Tests.
|
© EduRev
|
Education Revolution
|


|


Signup to see your scores
go up
within 7 days!
within 7 days!
Takes less than 10 seconds to signup