


GMAT Exam > GMAT Questions > The chart shows the breakdown of the stock ho...
Start Learning for Free
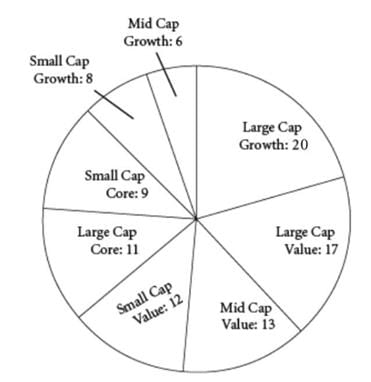
The chart shows the breakdown of the stock holdings in one investor’s portfolio, by number of company stocks held, each company’s market capitalization type (Large, Mid, or Small), and the type of stock (Growth, Core, or Value).
Q. Based on the given information, fill in the blanks in each of the following statements.
1. The Growth stocks in the investor’s portfolio represent ______ % of the total portfolio.
2. The investor has ______ times as many Large Cap stocks in her portfolio as Small Cap stocks.
- a)20.83, 0.60
- b)32, 1.28
- c)35.42, 1.66
- d)50, 2.18
- e)52, 3.2
Correct answer is option 'C'. Can you explain this answer?

Verified Answer
The chart shows the breakdown of the stock holdings in one investor&rs...
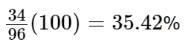
The investor has 20 Large Cap Growth stocks, 8 Small Cap Growth stocks, and 6 Mid Cap Growth stocks, for a total of 34 Growth stocks. In total, the investor has 96 stocks in her portfolio. Therefore, the percentage of growth stocks in the portfolio is:
The correct answer is (C).
The investor has 20 Large Cap Growth, 17 Large Cap Value, and 11 Large Cap Core stocks, for a total of 48 Large Cap stocks. She has 12 Small Cap Value, 9 Small Cap Core, and 8 Small Cap Growth stocks, for a total of 29 Small Cap stocks. If the investor has n times as many Large Cap stocks in her portfolio as Small Cap stocks, then:
48 = 29n
n = 1.66
The correct answer is (C).
The correct answer is (C).
The investor has 20 Large Cap Growth, 17 Large Cap Value, and 11 Large Cap Core stocks, for a total of 48 Large Cap stocks. She has 12 Small Cap Value, 9 Small Cap Core, and 8 Small Cap Growth stocks, for a total of 29 Small Cap stocks. If the investor has n times as many Large Cap stocks in her portfolio as Small Cap stocks, then:
48 = 29n
n = 1.66
The correct answer is (C).

|
Explore Courses for GMAT exam
|
|
Top Courses for GMATView all


Question Description
The chart shows the breakdown of the stock holdings in one investor’s portfolio, by number of company stocks held, each company’s market capitalization type (Large, Mid, or Small), and the type of stock (Growth, Core, or Value).Q. Based on the given information, fill in the blanks in each of the following statements.1. The Growth stocks in the investor’s portfolio represent ______% of the total portfolio.2. The investor has ______ times as many Large Cap stocks in her portfolio as Small Cap stocks.a)20.83, 0.60b)32, 1.28c)35.42, 1.66d)50, 2.18e)52, 3.2Correct answer is option 'C'. Can you explain this answer? for GMAT 2025 is part of GMAT preparation. The Question and answers have been prepared according to the GMAT exam syllabus. Information about The chart shows the breakdown of the stock holdings in one investor’s portfolio, by number of company stocks held, each company’s market capitalization type (Large, Mid, or Small), and the type of stock (Growth, Core, or Value).Q. Based on the given information, fill in the blanks in each of the following statements.1. The Growth stocks in the investor’s portfolio represent ______% of the total portfolio.2. The investor has ______ times as many Large Cap stocks in her portfolio as Small Cap stocks.a)20.83, 0.60b)32, 1.28c)35.42, 1.66d)50, 2.18e)52, 3.2Correct answer is option 'C'. Can you explain this answer? covers all topics & solutions for GMAT 2025 Exam. Find important definitions, questions, meanings, examples, exercises and tests below for The chart shows the breakdown of the stock holdings in one investor’s portfolio, by number of company stocks held, each company’s market capitalization type (Large, Mid, or Small), and the type of stock (Growth, Core, or Value).Q. Based on the given information, fill in the blanks in each of the following statements.1. The Growth stocks in the investor’s portfolio represent ______% of the total portfolio.2. The investor has ______ times as many Large Cap stocks in her portfolio as Small Cap stocks.a)20.83, 0.60b)32, 1.28c)35.42, 1.66d)50, 2.18e)52, 3.2Correct answer is option 'C'. Can you explain this answer?.
The chart shows the breakdown of the stock holdings in one investor’s portfolio, by number of company stocks held, each company’s market capitalization type (Large, Mid, or Small), and the type of stock (Growth, Core, or Value).Q. Based on the given information, fill in the blanks in each of the following statements.1. The Growth stocks in the investor’s portfolio represent ______% of the total portfolio.2. The investor has ______ times as many Large Cap stocks in her portfolio as Small Cap stocks.a)20.83, 0.60b)32, 1.28c)35.42, 1.66d)50, 2.18e)52, 3.2Correct answer is option 'C'. Can you explain this answer? for GMAT 2025 is part of GMAT preparation. The Question and answers have been prepared according to the GMAT exam syllabus. Information about The chart shows the breakdown of the stock holdings in one investor’s portfolio, by number of company stocks held, each company’s market capitalization type (Large, Mid, or Small), and the type of stock (Growth, Core, or Value).Q. Based on the given information, fill in the blanks in each of the following statements.1. The Growth stocks in the investor’s portfolio represent ______% of the total portfolio.2. The investor has ______ times as many Large Cap stocks in her portfolio as Small Cap stocks.a)20.83, 0.60b)32, 1.28c)35.42, 1.66d)50, 2.18e)52, 3.2Correct answer is option 'C'. Can you explain this answer? covers all topics & solutions for GMAT 2025 Exam. Find important definitions, questions, meanings, examples, exercises and tests below for The chart shows the breakdown of the stock holdings in one investor’s portfolio, by number of company stocks held, each company’s market capitalization type (Large, Mid, or Small), and the type of stock (Growth, Core, or Value).Q. Based on the given information, fill in the blanks in each of the following statements.1. The Growth stocks in the investor’s portfolio represent ______% of the total portfolio.2. The investor has ______ times as many Large Cap stocks in her portfolio as Small Cap stocks.a)20.83, 0.60b)32, 1.28c)35.42, 1.66d)50, 2.18e)52, 3.2Correct answer is option 'C'. Can you explain this answer?.
Solutions for The chart shows the breakdown of the stock holdings in one investor’s portfolio, by number of company stocks held, each company’s market capitalization type (Large, Mid, or Small), and the type of stock (Growth, Core, or Value).Q. Based on the given information, fill in the blanks in each of the following statements.1. The Growth stocks in the investor’s portfolio represent ______% of the total portfolio.2. The investor has ______ times as many Large Cap stocks in her portfolio as Small Cap stocks.a)20.83, 0.60b)32, 1.28c)35.42, 1.66d)50, 2.18e)52, 3.2Correct answer is option 'C'. Can you explain this answer? in English & in Hindi are available as part of our courses for GMAT.
Download more important topics, notes, lectures and mock test series for GMAT Exam by signing up for free.
Here you can find the meaning of The chart shows the breakdown of the stock holdings in one investor’s portfolio, by number of company stocks held, each company’s market capitalization type (Large, Mid, or Small), and the type of stock (Growth, Core, or Value).Q. Based on the given information, fill in the blanks in each of the following statements.1. The Growth stocks in the investor’s portfolio represent ______% of the total portfolio.2. The investor has ______ times as many Large Cap stocks in her portfolio as Small Cap stocks.a)20.83, 0.60b)32, 1.28c)35.42, 1.66d)50, 2.18e)52, 3.2Correct answer is option 'C'. Can you explain this answer? defined & explained in the simplest way possible. Besides giving the explanation of
The chart shows the breakdown of the stock holdings in one investor’s portfolio, by number of company stocks held, each company’s market capitalization type (Large, Mid, or Small), and the type of stock (Growth, Core, or Value).Q. Based on the given information, fill in the blanks in each of the following statements.1. The Growth stocks in the investor’s portfolio represent ______% of the total portfolio.2. The investor has ______ times as many Large Cap stocks in her portfolio as Small Cap stocks.a)20.83, 0.60b)32, 1.28c)35.42, 1.66d)50, 2.18e)52, 3.2Correct answer is option 'C'. Can you explain this answer?, a detailed solution for The chart shows the breakdown of the stock holdings in one investor’s portfolio, by number of company stocks held, each company’s market capitalization type (Large, Mid, or Small), and the type of stock (Growth, Core, or Value).Q. Based on the given information, fill in the blanks in each of the following statements.1. The Growth stocks in the investor’s portfolio represent ______% of the total portfolio.2. The investor has ______ times as many Large Cap stocks in her portfolio as Small Cap stocks.a)20.83, 0.60b)32, 1.28c)35.42, 1.66d)50, 2.18e)52, 3.2Correct answer is option 'C'. Can you explain this answer? has been provided alongside types of The chart shows the breakdown of the stock holdings in one investor’s portfolio, by number of company stocks held, each company’s market capitalization type (Large, Mid, or Small), and the type of stock (Growth, Core, or Value).Q. Based on the given information, fill in the blanks in each of the following statements.1. The Growth stocks in the investor’s portfolio represent ______% of the total portfolio.2. The investor has ______ times as many Large Cap stocks in her portfolio as Small Cap stocks.a)20.83, 0.60b)32, 1.28c)35.42, 1.66d)50, 2.18e)52, 3.2Correct answer is option 'C'. Can you explain this answer? theory, EduRev gives you an
ample number of questions to practice The chart shows the breakdown of the stock holdings in one investor’s portfolio, by number of company stocks held, each company’s market capitalization type (Large, Mid, or Small), and the type of stock (Growth, Core, or Value).Q. Based on the given information, fill in the blanks in each of the following statements.1. The Growth stocks in the investor’s portfolio represent ______% of the total portfolio.2. The investor has ______ times as many Large Cap stocks in her portfolio as Small Cap stocks.a)20.83, 0.60b)32, 1.28c)35.42, 1.66d)50, 2.18e)52, 3.2Correct answer is option 'C'. Can you explain this answer? tests, examples and also practice GMAT tests.
|
|
Explore Courses for GMAT exam
|
|

Signup for Free!
Signup to see your scores go up within 7 days! Learn & Practice with 1000+ FREE Notes, Videos & Tests.


|
© EduRev
|
Education Revolution
|


|


Signup to see your scores
go up within 7 days!
Access 1000+ FREE Docs, Videos and Tests
Takes less than 10 seconds to signup