


GMAT Exam > GMAT Questions > The graph shows the stock price and the earni...
Start Learning for Free
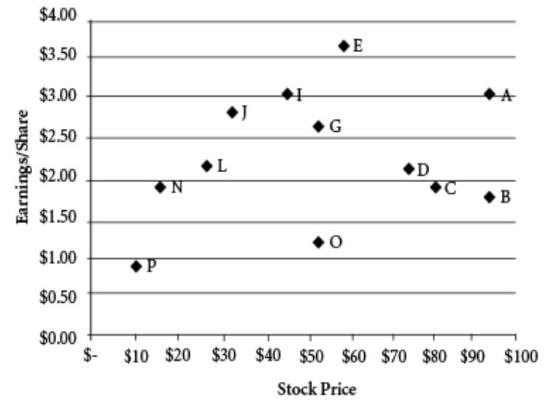
The graph shows the stock price and the earnings per share for a number of companies in the same sector. A company’s price-to-earnings (P/E) ratio is the ratio of the company’s stock price to the company’s earnings per share.
Q. Based on the given information, fill in the blanks in each of the following statements.
Q. Based on the given information, fill in the blanks in each of the following statements.
1. Of the companies whose stock price is greater than $60, ____have a P/E ratio greater than 40.
2. The number of companies that have a P/E ratio less than 10 is_____.
- a)1, 2
- b)3, 3
- c)5, 4
- d)4, 5
- e)2, 1
Correct answer is option 'E'. Can you explain this answer?

Verified Answer
The graph shows the stock price and the earnings per share for a numbe...
1. Four companies with stock price over 60$:
A, B, C and D.
A quick check gives us companies B and C that have P/E > 40
Ans: 2
2. Only 1 company (N) seems to have P/E less than 10. (Invest in this, folks )
)
Ans: 1
A, B, C and D.
A quick check gives us companies B and C that have P/E > 40
Ans: 2
2. Only 1 company (N) seems to have P/E less than 10. (Invest in this, folks
)Ans: 1

|
Explore Courses for GMAT exam
|
|
Top Courses for GMATView all


Question Description
The graph shows the stock price and the earnings per share for a number of companies in the same sector. A company’s price-to-earnings (P/E) ratio is the ratio of the company’s stock price to the company’s earnings per share.Q. Based on the given information, fill in the blanks in each of the following statements.1. Of the companies whose stock price is greater than $60, ____have a P/E ratio greater than 40.2. The number of companies that have a P/E ratio less than 10 is_____.a)1, 2b)3, 3c)5, 4d)4, 5e)2, 1Correct answer is option 'E'. Can you explain this answer? for GMAT 2025 is part of GMAT preparation. The Question and answers have been prepared according to the GMAT exam syllabus. Information about The graph shows the stock price and the earnings per share for a number of companies in the same sector. A company’s price-to-earnings (P/E) ratio is the ratio of the company’s stock price to the company’s earnings per share.Q. Based on the given information, fill in the blanks in each of the following statements.1. Of the companies whose stock price is greater than $60, ____have a P/E ratio greater than 40.2. The number of companies that have a P/E ratio less than 10 is_____.a)1, 2b)3, 3c)5, 4d)4, 5e)2, 1Correct answer is option 'E'. Can you explain this answer? covers all topics & solutions for GMAT 2025 Exam. Find important definitions, questions, meanings, examples, exercises and tests below for The graph shows the stock price and the earnings per share for a number of companies in the same sector. A company’s price-to-earnings (P/E) ratio is the ratio of the company’s stock price to the company’s earnings per share.Q. Based on the given information, fill in the blanks in each of the following statements.1. Of the companies whose stock price is greater than $60, ____have a P/E ratio greater than 40.2. The number of companies that have a P/E ratio less than 10 is_____.a)1, 2b)3, 3c)5, 4d)4, 5e)2, 1Correct answer is option 'E'. Can you explain this answer?.
The graph shows the stock price and the earnings per share for a number of companies in the same sector. A company’s price-to-earnings (P/E) ratio is the ratio of the company’s stock price to the company’s earnings per share.Q. Based on the given information, fill in the blanks in each of the following statements.1. Of the companies whose stock price is greater than $60, ____have a P/E ratio greater than 40.2. The number of companies that have a P/E ratio less than 10 is_____.a)1, 2b)3, 3c)5, 4d)4, 5e)2, 1Correct answer is option 'E'. Can you explain this answer? for GMAT 2025 is part of GMAT preparation. The Question and answers have been prepared according to the GMAT exam syllabus. Information about The graph shows the stock price and the earnings per share for a number of companies in the same sector. A company’s price-to-earnings (P/E) ratio is the ratio of the company’s stock price to the company’s earnings per share.Q. Based on the given information, fill in the blanks in each of the following statements.1. Of the companies whose stock price is greater than $60, ____have a P/E ratio greater than 40.2. The number of companies that have a P/E ratio less than 10 is_____.a)1, 2b)3, 3c)5, 4d)4, 5e)2, 1Correct answer is option 'E'. Can you explain this answer? covers all topics & solutions for GMAT 2025 Exam. Find important definitions, questions, meanings, examples, exercises and tests below for The graph shows the stock price and the earnings per share for a number of companies in the same sector. A company’s price-to-earnings (P/E) ratio is the ratio of the company’s stock price to the company’s earnings per share.Q. Based on the given information, fill in the blanks in each of the following statements.1. Of the companies whose stock price is greater than $60, ____have a P/E ratio greater than 40.2. The number of companies that have a P/E ratio less than 10 is_____.a)1, 2b)3, 3c)5, 4d)4, 5e)2, 1Correct answer is option 'E'. Can you explain this answer?.
Solutions for The graph shows the stock price and the earnings per share for a number of companies in the same sector. A company’s price-to-earnings (P/E) ratio is the ratio of the company’s stock price to the company’s earnings per share.Q. Based on the given information, fill in the blanks in each of the following statements.1. Of the companies whose stock price is greater than $60, ____have a P/E ratio greater than 40.2. The number of companies that have a P/E ratio less than 10 is_____.a)1, 2b)3, 3c)5, 4d)4, 5e)2, 1Correct answer is option 'E'. Can you explain this answer? in English & in Hindi are available as part of our courses for GMAT.
Download more important topics, notes, lectures and mock test series for GMAT Exam by signing up for free.
Here you can find the meaning of The graph shows the stock price and the earnings per share for a number of companies in the same sector. A company’s price-to-earnings (P/E) ratio is the ratio of the company’s stock price to the company’s earnings per share.Q. Based on the given information, fill in the blanks in each of the following statements.1. Of the companies whose stock price is greater than $60, ____have a P/E ratio greater than 40.2. The number of companies that have a P/E ratio less than 10 is_____.a)1, 2b)3, 3c)5, 4d)4, 5e)2, 1Correct answer is option 'E'. Can you explain this answer? defined & explained in the simplest way possible. Besides giving the explanation of
The graph shows the stock price and the earnings per share for a number of companies in the same sector. A company’s price-to-earnings (P/E) ratio is the ratio of the company’s stock price to the company’s earnings per share.Q. Based on the given information, fill in the blanks in each of the following statements.1. Of the companies whose stock price is greater than $60, ____have a P/E ratio greater than 40.2. The number of companies that have a P/E ratio less than 10 is_____.a)1, 2b)3, 3c)5, 4d)4, 5e)2, 1Correct answer is option 'E'. Can you explain this answer?, a detailed solution for The graph shows the stock price and the earnings per share for a number of companies in the same sector. A company’s price-to-earnings (P/E) ratio is the ratio of the company’s stock price to the company’s earnings per share.Q. Based on the given information, fill in the blanks in each of the following statements.1. Of the companies whose stock price is greater than $60, ____have a P/E ratio greater than 40.2. The number of companies that have a P/E ratio less than 10 is_____.a)1, 2b)3, 3c)5, 4d)4, 5e)2, 1Correct answer is option 'E'. Can you explain this answer? has been provided alongside types of The graph shows the stock price and the earnings per share for a number of companies in the same sector. A company’s price-to-earnings (P/E) ratio is the ratio of the company’s stock price to the company’s earnings per share.Q. Based on the given information, fill in the blanks in each of the following statements.1. Of the companies whose stock price is greater than $60, ____have a P/E ratio greater than 40.2. The number of companies that have a P/E ratio less than 10 is_____.a)1, 2b)3, 3c)5, 4d)4, 5e)2, 1Correct answer is option 'E'. Can you explain this answer? theory, EduRev gives you an
ample number of questions to practice The graph shows the stock price and the earnings per share for a number of companies in the same sector. A company’s price-to-earnings (P/E) ratio is the ratio of the company’s stock price to the company’s earnings per share.Q. Based on the given information, fill in the blanks in each of the following statements.1. Of the companies whose stock price is greater than $60, ____have a P/E ratio greater than 40.2. The number of companies that have a P/E ratio less than 10 is_____.a)1, 2b)3, 3c)5, 4d)4, 5e)2, 1Correct answer is option 'E'. Can you explain this answer? tests, examples and also practice GMAT tests.
|
|
Explore Courses for GMAT exam
|
|

Signup for Free!
Signup to see your scores go up within 7 days! Learn & Practice with 1000+ FREE Notes, Videos & Tests.


|
© EduRev
|
Education Revolution
|


|


Signup on EduRev and stay on top of your study goals
10M+ students crushing their study goals daily