


GMAT Exam > GMAT Questions > Refer to the pictograph reflecting the invest...
Start Learning for Free
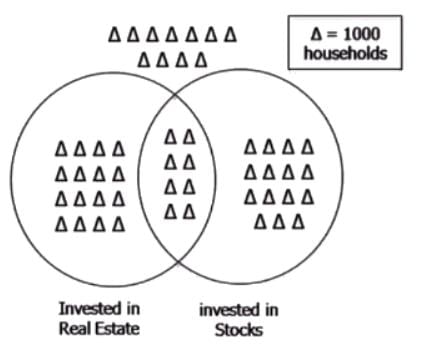
Refer to the pictograph reflecting the investment behavior of households in a city.
Households that invested in at least one of real estate and stocks represent _____of the total households in the city.
Households that invested in maximum one of the two investments - real estate and stocks - represent ____ of the households in the city.
- a)16, 62
- b)22, 22
- c)48, 16
- d)78, 84
- e)100, 38
Correct answer is option 'D'. Can you explain this answer?

Verified Answer
Refer to the pictograph reflecting the investment behavior of househol...
As the question said, "maximum one" It includes households with one and no investments but not both.
Household with both investments are = 8*1000= 8000
Total household = 50*1000 = 50,000
50,000-8,000= 42,000
(42,000/50,000)*100 = 84%

|
Explore Courses for GMAT exam
|
|
Top Courses for GMATView all


Question Description
Refer to the pictograph reflecting the investment behavior of households in a city.Households that invested in at least one of real estate and stocks represent _____of the total households in the city.Households that invested in maximum one of the two investments - real estate and stocks - represent ____ of the households in the city.a)16, 62b)22, 22c)48, 16d)78, 84e)100, 38Correct answer is option 'D'. Can you explain this answer? for GMAT 2025 is part of GMAT preparation. The Question and answers have been prepared according to the GMAT exam syllabus. Information about Refer to the pictograph reflecting the investment behavior of households in a city.Households that invested in at least one of real estate and stocks represent _____of the total households in the city.Households that invested in maximum one of the two investments - real estate and stocks - represent ____ of the households in the city.a)16, 62b)22, 22c)48, 16d)78, 84e)100, 38Correct answer is option 'D'. Can you explain this answer? covers all topics & solutions for GMAT 2025 Exam. Find important definitions, questions, meanings, examples, exercises and tests below for Refer to the pictograph reflecting the investment behavior of households in a city.Households that invested in at least one of real estate and stocks represent _____of the total households in the city.Households that invested in maximum one of the two investments - real estate and stocks - represent ____ of the households in the city.a)16, 62b)22, 22c)48, 16d)78, 84e)100, 38Correct answer is option 'D'. Can you explain this answer?.
Refer to the pictograph reflecting the investment behavior of households in a city.Households that invested in at least one of real estate and stocks represent _____of the total households in the city.Households that invested in maximum one of the two investments - real estate and stocks - represent ____ of the households in the city.a)16, 62b)22, 22c)48, 16d)78, 84e)100, 38Correct answer is option 'D'. Can you explain this answer? for GMAT 2025 is part of GMAT preparation. The Question and answers have been prepared according to the GMAT exam syllabus. Information about Refer to the pictograph reflecting the investment behavior of households in a city.Households that invested in at least one of real estate and stocks represent _____of the total households in the city.Households that invested in maximum one of the two investments - real estate and stocks - represent ____ of the households in the city.a)16, 62b)22, 22c)48, 16d)78, 84e)100, 38Correct answer is option 'D'. Can you explain this answer? covers all topics & solutions for GMAT 2025 Exam. Find important definitions, questions, meanings, examples, exercises and tests below for Refer to the pictograph reflecting the investment behavior of households in a city.Households that invested in at least one of real estate and stocks represent _____of the total households in the city.Households that invested in maximum one of the two investments - real estate and stocks - represent ____ of the households in the city.a)16, 62b)22, 22c)48, 16d)78, 84e)100, 38Correct answer is option 'D'. Can you explain this answer?.
Solutions for Refer to the pictograph reflecting the investment behavior of households in a city.Households that invested in at least one of real estate and stocks represent _____of the total households in the city.Households that invested in maximum one of the two investments - real estate and stocks - represent ____ of the households in the city.a)16, 62b)22, 22c)48, 16d)78, 84e)100, 38Correct answer is option 'D'. Can you explain this answer? in English & in Hindi are available as part of our courses for GMAT.
Download more important topics, notes, lectures and mock test series for GMAT Exam by signing up for free.
Here you can find the meaning of Refer to the pictograph reflecting the investment behavior of households in a city.Households that invested in at least one of real estate and stocks represent _____of the total households in the city.Households that invested in maximum one of the two investments - real estate and stocks - represent ____ of the households in the city.a)16, 62b)22, 22c)48, 16d)78, 84e)100, 38Correct answer is option 'D'. Can you explain this answer? defined & explained in the simplest way possible. Besides giving the explanation of
Refer to the pictograph reflecting the investment behavior of households in a city.Households that invested in at least one of real estate and stocks represent _____of the total households in the city.Households that invested in maximum one of the two investments - real estate and stocks - represent ____ of the households in the city.a)16, 62b)22, 22c)48, 16d)78, 84e)100, 38Correct answer is option 'D'. Can you explain this answer?, a detailed solution for Refer to the pictograph reflecting the investment behavior of households in a city.Households that invested in at least one of real estate and stocks represent _____of the total households in the city.Households that invested in maximum one of the two investments - real estate and stocks - represent ____ of the households in the city.a)16, 62b)22, 22c)48, 16d)78, 84e)100, 38Correct answer is option 'D'. Can you explain this answer? has been provided alongside types of Refer to the pictograph reflecting the investment behavior of households in a city.Households that invested in at least one of real estate and stocks represent _____of the total households in the city.Households that invested in maximum one of the two investments - real estate and stocks - represent ____ of the households in the city.a)16, 62b)22, 22c)48, 16d)78, 84e)100, 38Correct answer is option 'D'. Can you explain this answer? theory, EduRev gives you an
ample number of questions to practice Refer to the pictograph reflecting the investment behavior of households in a city.Households that invested in at least one of real estate and stocks represent _____of the total households in the city.Households that invested in maximum one of the two investments - real estate and stocks - represent ____ of the households in the city.a)16, 62b)22, 22c)48, 16d)78, 84e)100, 38Correct answer is option 'D'. Can you explain this answer? tests, examples and also practice GMAT tests.
|
|
Explore Courses for GMAT exam
|
|

Signup for Free!
Signup to see your scores go up within 7 days! Learn & Practice with 1000+ FREE Notes, Videos & Tests.


|
© EduRev
|
Education Revolution
|


|


Signup to see your scores
go up within 7 days!
Access 1000+ FREE Docs, Videos and Tests
Takes less than 10 seconds to signup