


GMAT Exam > GMAT Questions > The following table provides financial data f...
Start Learning for Free
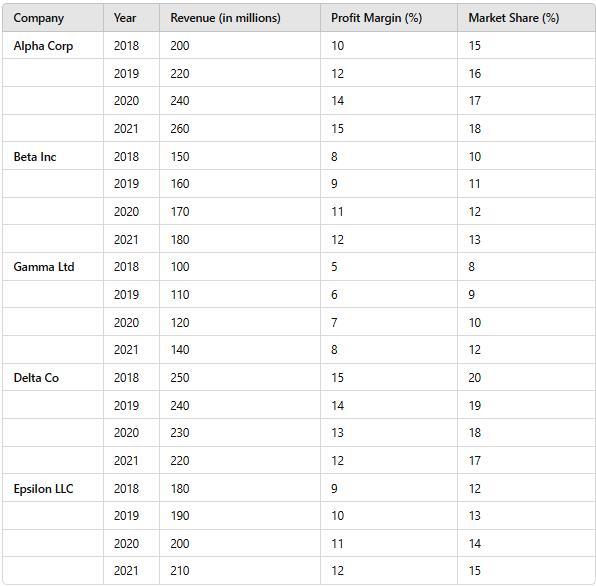
The following table provides financial data for five companies over the years 2018 to 2021. The data includes Revenue (in millions), Profit Margin (%), and Market Share (%).
Which company experienced the largest percentage increase in revenue from 2018 to 2021?
- a)Alpha Corp
- b)Beta Inc
- c)Gamma Ltd
- d)Epsilon LLC
Correct answer is option 'C'. Can you explain this answer?

Verified Answer
The following table provides financial data for five companies over th...
Calculate the percentage increase for each company:
Percentage Increase = [(Revenue in 2021 - Revenue in 2018) / Revenue in 2018] × 100%
Alpha Corp:
[(260 - 200) / 200] × 100% = 30%
Beta Inc:
[(180 - 150) / 150] × 100% = 20%
Gamma Ltd:
[(140 - 100) / 100] × 100% = 40%
Epsilon LLC:
[(210 - 180) / 180] × 100% ≈ 16.67%
Gamma Ltd has the largest percentage increase of 40%.

|
Explore Courses for GMAT exam
|
|
Top Courses for GMATView all


Question Description
The following table provides financial data for five companies over the years 2018 to 2021. The data includes Revenue (in millions), Profit Margin (%), and Market Share (%).Which company experienced the largest percentage increase in revenue from 2018 to 2021?a)Alpha Corpb)Beta Incc)Gamma Ltdd)Epsilon LLCCorrect answer is option 'C'. Can you explain this answer? for GMAT 2025 is part of GMAT preparation. The Question and answers have been prepared according to the GMAT exam syllabus. Information about The following table provides financial data for five companies over the years 2018 to 2021. The data includes Revenue (in millions), Profit Margin (%), and Market Share (%).Which company experienced the largest percentage increase in revenue from 2018 to 2021?a)Alpha Corpb)Beta Incc)Gamma Ltdd)Epsilon LLCCorrect answer is option 'C'. Can you explain this answer? covers all topics & solutions for GMAT 2025 Exam. Find important definitions, questions, meanings, examples, exercises and tests below for The following table provides financial data for five companies over the years 2018 to 2021. The data includes Revenue (in millions), Profit Margin (%), and Market Share (%).Which company experienced the largest percentage increase in revenue from 2018 to 2021?a)Alpha Corpb)Beta Incc)Gamma Ltdd)Epsilon LLCCorrect answer is option 'C'. Can you explain this answer?.
The following table provides financial data for five companies over the years 2018 to 2021. The data includes Revenue (in millions), Profit Margin (%), and Market Share (%).Which company experienced the largest percentage increase in revenue from 2018 to 2021?a)Alpha Corpb)Beta Incc)Gamma Ltdd)Epsilon LLCCorrect answer is option 'C'. Can you explain this answer? for GMAT 2025 is part of GMAT preparation. The Question and answers have been prepared according to the GMAT exam syllabus. Information about The following table provides financial data for five companies over the years 2018 to 2021. The data includes Revenue (in millions), Profit Margin (%), and Market Share (%).Which company experienced the largest percentage increase in revenue from 2018 to 2021?a)Alpha Corpb)Beta Incc)Gamma Ltdd)Epsilon LLCCorrect answer is option 'C'. Can you explain this answer? covers all topics & solutions for GMAT 2025 Exam. Find important definitions, questions, meanings, examples, exercises and tests below for The following table provides financial data for five companies over the years 2018 to 2021. The data includes Revenue (in millions), Profit Margin (%), and Market Share (%).Which company experienced the largest percentage increase in revenue from 2018 to 2021?a)Alpha Corpb)Beta Incc)Gamma Ltdd)Epsilon LLCCorrect answer is option 'C'. Can you explain this answer?.
Solutions for The following table provides financial data for five companies over the years 2018 to 2021. The data includes Revenue (in millions), Profit Margin (%), and Market Share (%).Which company experienced the largest percentage increase in revenue from 2018 to 2021?a)Alpha Corpb)Beta Incc)Gamma Ltdd)Epsilon LLCCorrect answer is option 'C'. Can you explain this answer? in English & in Hindi are available as part of our courses for GMAT.
Download more important topics, notes, lectures and mock test series for GMAT Exam by signing up for free.
Here you can find the meaning of The following table provides financial data for five companies over the years 2018 to 2021. The data includes Revenue (in millions), Profit Margin (%), and Market Share (%).Which company experienced the largest percentage increase in revenue from 2018 to 2021?a)Alpha Corpb)Beta Incc)Gamma Ltdd)Epsilon LLCCorrect answer is option 'C'. Can you explain this answer? defined & explained in the simplest way possible. Besides giving the explanation of
The following table provides financial data for five companies over the years 2018 to 2021. The data includes Revenue (in millions), Profit Margin (%), and Market Share (%).Which company experienced the largest percentage increase in revenue from 2018 to 2021?a)Alpha Corpb)Beta Incc)Gamma Ltdd)Epsilon LLCCorrect answer is option 'C'. Can you explain this answer?, a detailed solution for The following table provides financial data for five companies over the years 2018 to 2021. The data includes Revenue (in millions), Profit Margin (%), and Market Share (%).Which company experienced the largest percentage increase in revenue from 2018 to 2021?a)Alpha Corpb)Beta Incc)Gamma Ltdd)Epsilon LLCCorrect answer is option 'C'. Can you explain this answer? has been provided alongside types of The following table provides financial data for five companies over the years 2018 to 2021. The data includes Revenue (in millions), Profit Margin (%), and Market Share (%).Which company experienced the largest percentage increase in revenue from 2018 to 2021?a)Alpha Corpb)Beta Incc)Gamma Ltdd)Epsilon LLCCorrect answer is option 'C'. Can you explain this answer? theory, EduRev gives you an
ample number of questions to practice The following table provides financial data for five companies over the years 2018 to 2021. The data includes Revenue (in millions), Profit Margin (%), and Market Share (%).Which company experienced the largest percentage increase in revenue from 2018 to 2021?a)Alpha Corpb)Beta Incc)Gamma Ltdd)Epsilon LLCCorrect answer is option 'C'. Can you explain this answer? tests, examples and also practice GMAT tests.
|
|
Explore Courses for GMAT exam
|
|

Signup for Free!
Signup to see your scores go up within 7 days! Learn & Practice with 1000+ FREE Notes, Videos & Tests.
|
© EduRev
|
Education Revolution
|


|


Signup on EduRev and stay on top of your study goals
10M+ students crushing their study goals daily