


GMAT Exam > GMAT Questions > STOCKS CLASSIFICATIONHoly Faith Broking Compa...
Start Learning for Free
STOCKS CLASSIFICATION
Holy Faith Broking Company classifies stocks of listed companies on the basis of two parameters.
Stock Valuation Classification
TOP – ‘TOP’ is termed as the mean of daily values of “highest percentage increase in the stock price over last day’s closing price” over a period.
BOTTOM - ‘BOTTOM’ is termed as the mean of daily values of “lowest percentage increase or highest percent decrease, as the case may be, in the stock price over last day’s closing price” over a period.
Stable Cow - A stock whose TOP is less than 15% and BOTTOM is more than 8%.
Volatile Bull - A stock whose TOP is more than 30% and BOTTOM is less than 10%.
Volatile Bear - A stock whose TOP is less than 10% and BOTTOM is less than -10%.
Profit Generation Capability
Struggler - A stock whose issuing company makes a profit between 1% to 5% of its revenue. (Both inclusive)
Dessert - A stock whose issuing company makes a loss of more than 1% of its revenue.
Rain Maker - A stock whose issuing company makes a profit of more than 10% of its revenue.
CHARTS
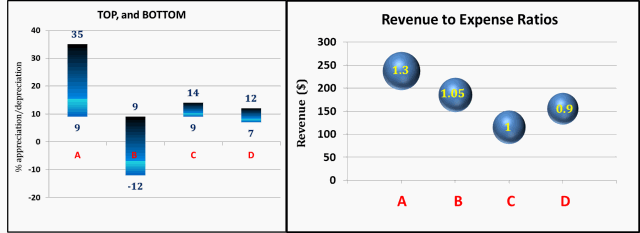
The two graphs given below are for stocks of companies A, B, C, and D. The first graph shows mean of daily values of “percentage increase or decrease in the stock price over last day’s closing price” over a period. The second graph represents revenue to expense ratio (data label on the bubble) & revenue for these four companies. Centers of bubbles represent revenue of the company (on Y axis).
The two graphs given below are for stocks of companies A, B, C, and D. The first graph shows mean of daily values of “percentage increase or decrease in the stock price over last day’s closing price” over a period. The second graph represents revenue to expense ratio (data label on the bubble) & revenue for these four companies. Centers of bubbles represent revenue of the company (on Y axis).
Select the company pair below whose combined revenue to combined expense ratio is the least?
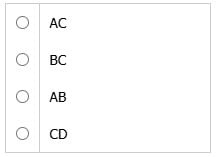
- a)AC
- b)CD
- c)BC
- d)AB
Correct answer is option 'B'. Can you explain this answer?

Most Upvoted Answer
STOCKS CLASSIFICATIONHoly Faith Broking Company classifies stocks of l...
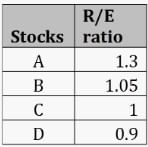
We should be wary of the fact that the question asks for combined revenue to combined expense ratio. We must not simply add their R/E ratios. From chart 2, we get their respective R/E values.
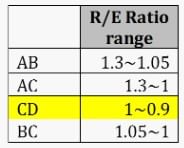
We need not calculate combined revenue and combined expense for each of the options. Logically, R/E ratios for C and D lie in bottom two, hence their combined revenue, and combined expense will also be least. So the answer is CD. The table below shows that combined revenue to combined expense ratio for CD will be the lowest. It lies between 1~0.9.
We need not calculate combined revenue and combined expense for each of the options. Logically, R/E ratios for C and D lie in bottom two, hence their combined revenue, and combined expense will also be least. So the answer is CD. The table below shows that combined revenue to combined expense ratio for CD will be the lowest. It lies between 1~0.9.

|
Explore Courses for GMAT exam
|
|
Top Courses for GMATView all


Question Description
STOCKS CLASSIFICATIONHoly Faith Broking Company classifies stocks of listed companies on the basis of two parameters.Stock Valuation ClassificationTOP– ‘TOP’ is termed as the mean of daily values of “highest percentage increase in the stock price over last day’s closing price” over a period.BOTTOM- ‘BOTTOM’ is termed as the mean of daily values of “lowest percentage increase or highest percent decrease, as the case may be, in the stock price over last day’s closing price” over a period.Stable Cow- A stock whose TOP is less than 15% and BOTTOM is more than 8%.Volatile Bull- A stock whose TOP is more than 30% and BOTTOM is less than 10%.Volatile Bear- A stock whose TOP is less than 10% and BOTTOM is less than -10%.Profit Generation CapabilityStruggler- A stock whose issuing company makes a profit between 1% to 5% of its revenue. (Both inclusive)Dessert- A stock whose issuing company makes a loss of more than 1% of its revenue.Rain Maker- A stock whose issuing company makes a profit of more than 10% of its revenue.CHARTSThe two graphs given below are for stocks of companies A, B, C, and D. The first graph shows mean of daily values of “percentage increase or decrease in the stock price over last day’s closing price” over a period. The second graph represents revenue to expense ratio (data label on the bubble) & revenue for these four companies. Centers of bubbles represent revenue of the company (on Y axis).Select the company pair below whose combined revenue to combined expense ratio is the least?a)ACb)CDc)BCd)ABCorrect answer is option 'B'. Can you explain this answer? for GMAT 2025 is part of GMAT preparation. The Question and answers have been prepared according to the GMAT exam syllabus. Information about STOCKS CLASSIFICATIONHoly Faith Broking Company classifies stocks of listed companies on the basis of two parameters.Stock Valuation ClassificationTOP– ‘TOP’ is termed as the mean of daily values of “highest percentage increase in the stock price over last day’s closing price” over a period.BOTTOM- ‘BOTTOM’ is termed as the mean of daily values of “lowest percentage increase or highest percent decrease, as the case may be, in the stock price over last day’s closing price” over a period.Stable Cow- A stock whose TOP is less than 15% and BOTTOM is more than 8%.Volatile Bull- A stock whose TOP is more than 30% and BOTTOM is less than 10%.Volatile Bear- A stock whose TOP is less than 10% and BOTTOM is less than -10%.Profit Generation CapabilityStruggler- A stock whose issuing company makes a profit between 1% to 5% of its revenue. (Both inclusive)Dessert- A stock whose issuing company makes a loss of more than 1% of its revenue.Rain Maker- A stock whose issuing company makes a profit of more than 10% of its revenue.CHARTSThe two graphs given below are for stocks of companies A, B, C, and D. The first graph shows mean of daily values of “percentage increase or decrease in the stock price over last day’s closing price” over a period. The second graph represents revenue to expense ratio (data label on the bubble) & revenue for these four companies. Centers of bubbles represent revenue of the company (on Y axis).Select the company pair below whose combined revenue to combined expense ratio is the least?a)ACb)CDc)BCd)ABCorrect answer is option 'B'. Can you explain this answer? covers all topics & solutions for GMAT 2025 Exam. Find important definitions, questions, meanings, examples, exercises and tests below for STOCKS CLASSIFICATIONHoly Faith Broking Company classifies stocks of listed companies on the basis of two parameters.Stock Valuation ClassificationTOP– ‘TOP’ is termed as the mean of daily values of “highest percentage increase in the stock price over last day’s closing price” over a period.BOTTOM- ‘BOTTOM’ is termed as the mean of daily values of “lowest percentage increase or highest percent decrease, as the case may be, in the stock price over last day’s closing price” over a period.Stable Cow- A stock whose TOP is less than 15% and BOTTOM is more than 8%.Volatile Bull- A stock whose TOP is more than 30% and BOTTOM is less than 10%.Volatile Bear- A stock whose TOP is less than 10% and BOTTOM is less than -10%.Profit Generation CapabilityStruggler- A stock whose issuing company makes a profit between 1% to 5% of its revenue. (Both inclusive)Dessert- A stock whose issuing company makes a loss of more than 1% of its revenue.Rain Maker- A stock whose issuing company makes a profit of more than 10% of its revenue.CHARTSThe two graphs given below are for stocks of companies A, B, C, and D. The first graph shows mean of daily values of “percentage increase or decrease in the stock price over last day’s closing price” over a period. The second graph represents revenue to expense ratio (data label on the bubble) & revenue for these four companies. Centers of bubbles represent revenue of the company (on Y axis).Select the company pair below whose combined revenue to combined expense ratio is the least?a)ACb)CDc)BCd)ABCorrect answer is option 'B'. Can you explain this answer?.
STOCKS CLASSIFICATIONHoly Faith Broking Company classifies stocks of listed companies on the basis of two parameters.Stock Valuation ClassificationTOP– ‘TOP’ is termed as the mean of daily values of “highest percentage increase in the stock price over last day’s closing price” over a period.BOTTOM- ‘BOTTOM’ is termed as the mean of daily values of “lowest percentage increase or highest percent decrease, as the case may be, in the stock price over last day’s closing price” over a period.Stable Cow- A stock whose TOP is less than 15% and BOTTOM is more than 8%.Volatile Bull- A stock whose TOP is more than 30% and BOTTOM is less than 10%.Volatile Bear- A stock whose TOP is less than 10% and BOTTOM is less than -10%.Profit Generation CapabilityStruggler- A stock whose issuing company makes a profit between 1% to 5% of its revenue. (Both inclusive)Dessert- A stock whose issuing company makes a loss of more than 1% of its revenue.Rain Maker- A stock whose issuing company makes a profit of more than 10% of its revenue.CHARTSThe two graphs given below are for stocks of companies A, B, C, and D. The first graph shows mean of daily values of “percentage increase or decrease in the stock price over last day’s closing price” over a period. The second graph represents revenue to expense ratio (data label on the bubble) & revenue for these four companies. Centers of bubbles represent revenue of the company (on Y axis).Select the company pair below whose combined revenue to combined expense ratio is the least?a)ACb)CDc)BCd)ABCorrect answer is option 'B'. Can you explain this answer? for GMAT 2025 is part of GMAT preparation. The Question and answers have been prepared according to the GMAT exam syllabus. Information about STOCKS CLASSIFICATIONHoly Faith Broking Company classifies stocks of listed companies on the basis of two parameters.Stock Valuation ClassificationTOP– ‘TOP’ is termed as the mean of daily values of “highest percentage increase in the stock price over last day’s closing price” over a period.BOTTOM- ‘BOTTOM’ is termed as the mean of daily values of “lowest percentage increase or highest percent decrease, as the case may be, in the stock price over last day’s closing price” over a period.Stable Cow- A stock whose TOP is less than 15% and BOTTOM is more than 8%.Volatile Bull- A stock whose TOP is more than 30% and BOTTOM is less than 10%.Volatile Bear- A stock whose TOP is less than 10% and BOTTOM is less than -10%.Profit Generation CapabilityStruggler- A stock whose issuing company makes a profit between 1% to 5% of its revenue. (Both inclusive)Dessert- A stock whose issuing company makes a loss of more than 1% of its revenue.Rain Maker- A stock whose issuing company makes a profit of more than 10% of its revenue.CHARTSThe two graphs given below are for stocks of companies A, B, C, and D. The first graph shows mean of daily values of “percentage increase or decrease in the stock price over last day’s closing price” over a period. The second graph represents revenue to expense ratio (data label on the bubble) & revenue for these four companies. Centers of bubbles represent revenue of the company (on Y axis).Select the company pair below whose combined revenue to combined expense ratio is the least?a)ACb)CDc)BCd)ABCorrect answer is option 'B'. Can you explain this answer? covers all topics & solutions for GMAT 2025 Exam. Find important definitions, questions, meanings, examples, exercises and tests below for STOCKS CLASSIFICATIONHoly Faith Broking Company classifies stocks of listed companies on the basis of two parameters.Stock Valuation ClassificationTOP– ‘TOP’ is termed as the mean of daily values of “highest percentage increase in the stock price over last day’s closing price” over a period.BOTTOM- ‘BOTTOM’ is termed as the mean of daily values of “lowest percentage increase or highest percent decrease, as the case may be, in the stock price over last day’s closing price” over a period.Stable Cow- A stock whose TOP is less than 15% and BOTTOM is more than 8%.Volatile Bull- A stock whose TOP is more than 30% and BOTTOM is less than 10%.Volatile Bear- A stock whose TOP is less than 10% and BOTTOM is less than -10%.Profit Generation CapabilityStruggler- A stock whose issuing company makes a profit between 1% to 5% of its revenue. (Both inclusive)Dessert- A stock whose issuing company makes a loss of more than 1% of its revenue.Rain Maker- A stock whose issuing company makes a profit of more than 10% of its revenue.CHARTSThe two graphs given below are for stocks of companies A, B, C, and D. The first graph shows mean of daily values of “percentage increase or decrease in the stock price over last day’s closing price” over a period. The second graph represents revenue to expense ratio (data label on the bubble) & revenue for these four companies. Centers of bubbles represent revenue of the company (on Y axis).Select the company pair below whose combined revenue to combined expense ratio is the least?a)ACb)CDc)BCd)ABCorrect answer is option 'B'. Can you explain this answer?.
Solutions for STOCKS CLASSIFICATIONHoly Faith Broking Company classifies stocks of listed companies on the basis of two parameters.Stock Valuation ClassificationTOP– ‘TOP’ is termed as the mean of daily values of “highest percentage increase in the stock price over last day’s closing price” over a period.BOTTOM- ‘BOTTOM’ is termed as the mean of daily values of “lowest percentage increase or highest percent decrease, as the case may be, in the stock price over last day’s closing price” over a period.Stable Cow- A stock whose TOP is less than 15% and BOTTOM is more than 8%.Volatile Bull- A stock whose TOP is more than 30% and BOTTOM is less than 10%.Volatile Bear- A stock whose TOP is less than 10% and BOTTOM is less than -10%.Profit Generation CapabilityStruggler- A stock whose issuing company makes a profit between 1% to 5% of its revenue. (Both inclusive)Dessert- A stock whose issuing company makes a loss of more than 1% of its revenue.Rain Maker- A stock whose issuing company makes a profit of more than 10% of its revenue.CHARTSThe two graphs given below are for stocks of companies A, B, C, and D. The first graph shows mean of daily values of “percentage increase or decrease in the stock price over last day’s closing price” over a period. The second graph represents revenue to expense ratio (data label on the bubble) & revenue for these four companies. Centers of bubbles represent revenue of the company (on Y axis).Select the company pair below whose combined revenue to combined expense ratio is the least?a)ACb)CDc)BCd)ABCorrect answer is option 'B'. Can you explain this answer? in English & in Hindi are available as part of our courses for GMAT.
Download more important topics, notes, lectures and mock test series for GMAT Exam by signing up for free.
Here you can find the meaning of STOCKS CLASSIFICATIONHoly Faith Broking Company classifies stocks of listed companies on the basis of two parameters.Stock Valuation ClassificationTOP– ‘TOP’ is termed as the mean of daily values of “highest percentage increase in the stock price over last day’s closing price” over a period.BOTTOM- ‘BOTTOM’ is termed as the mean of daily values of “lowest percentage increase or highest percent decrease, as the case may be, in the stock price over last day’s closing price” over a period.Stable Cow- A stock whose TOP is less than 15% and BOTTOM is more than 8%.Volatile Bull- A stock whose TOP is more than 30% and BOTTOM is less than 10%.Volatile Bear- A stock whose TOP is less than 10% and BOTTOM is less than -10%.Profit Generation CapabilityStruggler- A stock whose issuing company makes a profit between 1% to 5% of its revenue. (Both inclusive)Dessert- A stock whose issuing company makes a loss of more than 1% of its revenue.Rain Maker- A stock whose issuing company makes a profit of more than 10% of its revenue.CHARTSThe two graphs given below are for stocks of companies A, B, C, and D. The first graph shows mean of daily values of “percentage increase or decrease in the stock price over last day’s closing price” over a period. The second graph represents revenue to expense ratio (data label on the bubble) & revenue for these four companies. Centers of bubbles represent revenue of the company (on Y axis).Select the company pair below whose combined revenue to combined expense ratio is the least?a)ACb)CDc)BCd)ABCorrect answer is option 'B'. Can you explain this answer? defined & explained in the simplest way possible. Besides giving the explanation of
STOCKS CLASSIFICATIONHoly Faith Broking Company classifies stocks of listed companies on the basis of two parameters.Stock Valuation ClassificationTOP– ‘TOP’ is termed as the mean of daily values of “highest percentage increase in the stock price over last day’s closing price” over a period.BOTTOM- ‘BOTTOM’ is termed as the mean of daily values of “lowest percentage increase or highest percent decrease, as the case may be, in the stock price over last day’s closing price” over a period.Stable Cow- A stock whose TOP is less than 15% and BOTTOM is more than 8%.Volatile Bull- A stock whose TOP is more than 30% and BOTTOM is less than 10%.Volatile Bear- A stock whose TOP is less than 10% and BOTTOM is less than -10%.Profit Generation CapabilityStruggler- A stock whose issuing company makes a profit between 1% to 5% of its revenue. (Both inclusive)Dessert- A stock whose issuing company makes a loss of more than 1% of its revenue.Rain Maker- A stock whose issuing company makes a profit of more than 10% of its revenue.CHARTSThe two graphs given below are for stocks of companies A, B, C, and D. The first graph shows mean of daily values of “percentage increase or decrease in the stock price over last day’s closing price” over a period. The second graph represents revenue to expense ratio (data label on the bubble) & revenue for these four companies. Centers of bubbles represent revenue of the company (on Y axis).Select the company pair below whose combined revenue to combined expense ratio is the least?a)ACb)CDc)BCd)ABCorrect answer is option 'B'. Can you explain this answer?, a detailed solution for STOCKS CLASSIFICATIONHoly Faith Broking Company classifies stocks of listed companies on the basis of two parameters.Stock Valuation ClassificationTOP– ‘TOP’ is termed as the mean of daily values of “highest percentage increase in the stock price over last day’s closing price” over a period.BOTTOM- ‘BOTTOM’ is termed as the mean of daily values of “lowest percentage increase or highest percent decrease, as the case may be, in the stock price over last day’s closing price” over a period.Stable Cow- A stock whose TOP is less than 15% and BOTTOM is more than 8%.Volatile Bull- A stock whose TOP is more than 30% and BOTTOM is less than 10%.Volatile Bear- A stock whose TOP is less than 10% and BOTTOM is less than -10%.Profit Generation CapabilityStruggler- A stock whose issuing company makes a profit between 1% to 5% of its revenue. (Both inclusive)Dessert- A stock whose issuing company makes a loss of more than 1% of its revenue.Rain Maker- A stock whose issuing company makes a profit of more than 10% of its revenue.CHARTSThe two graphs given below are for stocks of companies A, B, C, and D. The first graph shows mean of daily values of “percentage increase or decrease in the stock price over last day’s closing price” over a period. The second graph represents revenue to expense ratio (data label on the bubble) & revenue for these four companies. Centers of bubbles represent revenue of the company (on Y axis).Select the company pair below whose combined revenue to combined expense ratio is the least?a)ACb)CDc)BCd)ABCorrect answer is option 'B'. Can you explain this answer? has been provided alongside types of STOCKS CLASSIFICATIONHoly Faith Broking Company classifies stocks of listed companies on the basis of two parameters.Stock Valuation ClassificationTOP– ‘TOP’ is termed as the mean of daily values of “highest percentage increase in the stock price over last day’s closing price” over a period.BOTTOM- ‘BOTTOM’ is termed as the mean of daily values of “lowest percentage increase or highest percent decrease, as the case may be, in the stock price over last day’s closing price” over a period.Stable Cow- A stock whose TOP is less than 15% and BOTTOM is more than 8%.Volatile Bull- A stock whose TOP is more than 30% and BOTTOM is less than 10%.Volatile Bear- A stock whose TOP is less than 10% and BOTTOM is less than -10%.Profit Generation CapabilityStruggler- A stock whose issuing company makes a profit between 1% to 5% of its revenue. (Both inclusive)Dessert- A stock whose issuing company makes a loss of more than 1% of its revenue.Rain Maker- A stock whose issuing company makes a profit of more than 10% of its revenue.CHARTSThe two graphs given below are for stocks of companies A, B, C, and D. The first graph shows mean of daily values of “percentage increase or decrease in the stock price over last day’s closing price” over a period. The second graph represents revenue to expense ratio (data label on the bubble) & revenue for these four companies. Centers of bubbles represent revenue of the company (on Y axis).Select the company pair below whose combined revenue to combined expense ratio is the least?a)ACb)CDc)BCd)ABCorrect answer is option 'B'. Can you explain this answer? theory, EduRev gives you an
ample number of questions to practice STOCKS CLASSIFICATIONHoly Faith Broking Company classifies stocks of listed companies on the basis of two parameters.Stock Valuation ClassificationTOP– ‘TOP’ is termed as the mean of daily values of “highest percentage increase in the stock price over last day’s closing price” over a period.BOTTOM- ‘BOTTOM’ is termed as the mean of daily values of “lowest percentage increase or highest percent decrease, as the case may be, in the stock price over last day’s closing price” over a period.Stable Cow- A stock whose TOP is less than 15% and BOTTOM is more than 8%.Volatile Bull- A stock whose TOP is more than 30% and BOTTOM is less than 10%.Volatile Bear- A stock whose TOP is less than 10% and BOTTOM is less than -10%.Profit Generation CapabilityStruggler- A stock whose issuing company makes a profit between 1% to 5% of its revenue. (Both inclusive)Dessert- A stock whose issuing company makes a loss of more than 1% of its revenue.Rain Maker- A stock whose issuing company makes a profit of more than 10% of its revenue.CHARTSThe two graphs given below are for stocks of companies A, B, C, and D. The first graph shows mean of daily values of “percentage increase or decrease in the stock price over last day’s closing price” over a period. The second graph represents revenue to expense ratio (data label on the bubble) & revenue for these four companies. Centers of bubbles represent revenue of the company (on Y axis).Select the company pair below whose combined revenue to combined expense ratio is the least?a)ACb)CDc)BCd)ABCorrect answer is option 'B'. Can you explain this answer? tests, examples and also practice GMAT tests.
|
|
Explore Courses for GMAT exam
|
|

Signup for Free!
Signup to see your scores go up within 7 days! Learn & Practice with 1000+ FREE Notes, Videos & Tests.
|
© EduRev
|
Education Revolution
|


|


Signup to see your scores
go up
within 7 days!
within 7 days!
Takes less than 10 seconds to signup