


GMAT Exam > GMAT Questions > Throughout a certain decade in a European cit...
Start Learning for Free
Throughout a certain decade in a European city, the mean monthly rents for studio apartments varied yearly, from a low of €804 to a high of €1,173. Those for one-bedroom apartments also varied yearly, from a low of €1,060 to a high of €1,497. But some individual studio apartments rented for as little as €420 in some years, and some one-bedroom apartments rented for up to €2,262. To visually assess how the ratio of mean monthly rents for studio apartments to those for one-bedroom apartments varied yearly over the decade, Maria requires a graph with the following characteristics. The graph will have two axes of equal length, with mean rents for one-bedroom apartments shown on the horizontal axis and mean rents for studio apartments shown on the vertical axis, and with the same scale on both axes. For each year, mean rents will be plotted as a point.
From the following options, select for Horizontal axis a range for the points on the horizontal axis and select for Vertical axis a range for the points on the vertical axis that together would satisfy Maria's requirements for the graph. Make only two selections, one in each column.
From the following options, select for Horizontal axis a range for the points on the horizontal axis and select for Vertical axis a range for the points on the vertical axis that together would satisfy Maria's requirements for the graph. Make only two selections, one in each column.
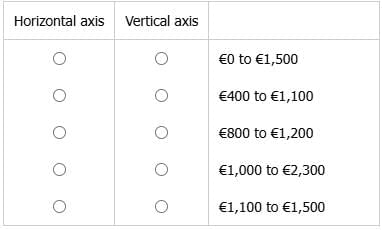
- a)Horizontal axis - €400 to €1,100
Vertical axis - €800 to €1,200 - b)Horizontal axis - €0 to €1,500
Vertical axis - €0 to €1,500 - c)Horizontal axis - €1,000 to €2,300
Vertical axis - €0 to €1,500 - d)Horizontal axis - €1,100 to €1,500
Vertical axis - €400 to €1,100 - e)Horizontal axis - €400 to €1,100
Vertical axis - €1,000 to €2,300
Correct answer is option 'B'. Can you explain this answer?

Most Upvoted Answer
Throughout a certain decade in a European city, the mean monthly rents...
The graph must have the following characteristics:
- two axes of equal length
- mean rents for one-bedroom apartments shown on the horizontal axis
- mean rents for studio apartments shown on the vertical axis
- the same scale on both axes
- For each year, mean rents will be plotted as a point.
The passage provides several values. However, the graph will show only mean rents. So, the only values that matter are the following:
Studio apartments:
a low of €804 to a high of €1,173
a low of €804 to a high of €1,173
One-bedroom apartments:
a low of €1,060 to a high of €1,497
a low of €1,060 to a high of €1,497
So, the axis for studio apartments must go at least from around 800 to around 1,200, and the axis for one-bedroom aparments must go at least from around 1,000 to around 1500.
- €0 to €1,500
- €400 to €1,100
- €800 to €1,200
- €1,000 to €2,300
- €1,100 to €1,500
One of the characteristics of the graph is that it has two axes of equal length. Scanning the choices, we see that only two are of the same length: €800 to €1,200 and €1,100 to €1,500.
€800 to €1,200 would work for studio apartments since it allows for a low of €804 and a high of €1,173.
However, €1,100 to €1,500 does not work for one-bedroom apartments since it does not allow for the low of €1,060.
So, it must be the case that one of the choices works for both axes since only by using one choice for both can we get axes of equal length and include all the values.
(Also, by the way, if one choice works for both, that choice must be the correct answer since the question cannot be answerable in two ways.)
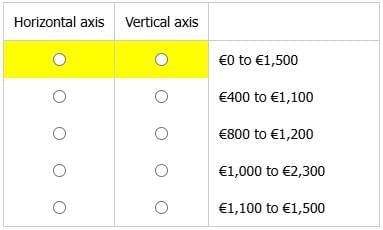
To have the points for all the values of mean rents, the axes must go at least from a low of around 800 to a high of around 1,500. The only choice that includes both of those values is €0 to €1,500.
So, the correct answer for both Horizontal axis and Vertical axis is €0 to €1,500.
Answer: €0 to €1,500, €0 to €1,500
€800 to €1,200 would work for studio apartments since it allows for a low of €804 and a high of €1,173.
However, €1,100 to €1,500 does not work for one-bedroom apartments since it does not allow for the low of €1,060.
So, it must be the case that one of the choices works for both axes since only by using one choice for both can we get axes of equal length and include all the values.
(Also, by the way, if one choice works for both, that choice must be the correct answer since the question cannot be answerable in two ways.)
To have the points for all the values of mean rents, the axes must go at least from a low of around 800 to a high of around 1,500. The only choice that includes both of those values is €0 to €1,500.
So, the correct answer for both Horizontal axis and Vertical axis is €0 to €1,500.
Answer: €0 to €1,500, €0 to €1,500

|
Explore Courses for GMAT exam
|
|
Top Courses for GMATView all


Question Description
Throughout a certain decade in a European city, the mean monthly rents for studio apartments varied yearly, from a low of €804 to a high of €1,173. Those for one-bedroom apartments also varied yearly, from a low of €1,060 to a high of €1,497. But some individual studio apartments rented for as little as €420 in some years, and some one-bedroom apartments rented for up to €2,262. To visually assess how the ratio of mean monthly rents for studio apartments to those for one-bedroom apartments varied yearly over the decade, Maria requires a graph with the following characteristics. The graph will have two axes of equal length, with mean rents for one-bedroom apartments shown on the horizontal axis and mean rents for studio apartments shown on the vertical axis, and with the same scale on both axes. For each year, mean rents will be plotted as a point.From the following options, select for Horizontal axis a range for the points on the horizontal axis and select for Vertical axis a range for the points on the vertical axis that together would satisfy Maria's requirements for the graph. Make only two selections, one in each column.a)Horizontal axis - €400 to €1,100Vertical axis - €800 to €1,200b)Horizontal axis - €0 to €1,500Vertical axis - €0 to €1,500c)Horizontal axis - €1,000 to €2,300Vertical axis - €0 to €1,500d)Horizontal axis - €1,100 to €1,500Vertical axis - €400 to €1,100e)Horizontal axis - €400 to €1,100Vertical axis - €1,000 to €2,300Correct answer is option 'B'. Can you explain this answer? for GMAT 2025 is part of GMAT preparation. The Question and answers have been prepared according to the GMAT exam syllabus. Information about Throughout a certain decade in a European city, the mean monthly rents for studio apartments varied yearly, from a low of €804 to a high of €1,173. Those for one-bedroom apartments also varied yearly, from a low of €1,060 to a high of €1,497. But some individual studio apartments rented for as little as €420 in some years, and some one-bedroom apartments rented for up to €2,262. To visually assess how the ratio of mean monthly rents for studio apartments to those for one-bedroom apartments varied yearly over the decade, Maria requires a graph with the following characteristics. The graph will have two axes of equal length, with mean rents for one-bedroom apartments shown on the horizontal axis and mean rents for studio apartments shown on the vertical axis, and with the same scale on both axes. For each year, mean rents will be plotted as a point.From the following options, select for Horizontal axis a range for the points on the horizontal axis and select for Vertical axis a range for the points on the vertical axis that together would satisfy Maria's requirements for the graph. Make only two selections, one in each column.a)Horizontal axis - €400 to €1,100Vertical axis - €800 to €1,200b)Horizontal axis - €0 to €1,500Vertical axis - €0 to €1,500c)Horizontal axis - €1,000 to €2,300Vertical axis - €0 to €1,500d)Horizontal axis - €1,100 to €1,500Vertical axis - €400 to €1,100e)Horizontal axis - €400 to €1,100Vertical axis - €1,000 to €2,300Correct answer is option 'B'. Can you explain this answer? covers all topics & solutions for GMAT 2025 Exam. Find important definitions, questions, meanings, examples, exercises and tests below for Throughout a certain decade in a European city, the mean monthly rents for studio apartments varied yearly, from a low of €804 to a high of €1,173. Those for one-bedroom apartments also varied yearly, from a low of €1,060 to a high of €1,497. But some individual studio apartments rented for as little as €420 in some years, and some one-bedroom apartments rented for up to €2,262. To visually assess how the ratio of mean monthly rents for studio apartments to those for one-bedroom apartments varied yearly over the decade, Maria requires a graph with the following characteristics. The graph will have two axes of equal length, with mean rents for one-bedroom apartments shown on the horizontal axis and mean rents for studio apartments shown on the vertical axis, and with the same scale on both axes. For each year, mean rents will be plotted as a point.From the following options, select for Horizontal axis a range for the points on the horizontal axis and select for Vertical axis a range for the points on the vertical axis that together would satisfy Maria's requirements for the graph. Make only two selections, one in each column.a)Horizontal axis - €400 to €1,100Vertical axis - €800 to €1,200b)Horizontal axis - €0 to €1,500Vertical axis - €0 to €1,500c)Horizontal axis - €1,000 to €2,300Vertical axis - €0 to €1,500d)Horizontal axis - €1,100 to €1,500Vertical axis - €400 to €1,100e)Horizontal axis - €400 to €1,100Vertical axis - €1,000 to €2,300Correct answer is option 'B'. Can you explain this answer?.
Throughout a certain decade in a European city, the mean monthly rents for studio apartments varied yearly, from a low of €804 to a high of €1,173. Those for one-bedroom apartments also varied yearly, from a low of €1,060 to a high of €1,497. But some individual studio apartments rented for as little as €420 in some years, and some one-bedroom apartments rented for up to €2,262. To visually assess how the ratio of mean monthly rents for studio apartments to those for one-bedroom apartments varied yearly over the decade, Maria requires a graph with the following characteristics. The graph will have two axes of equal length, with mean rents for one-bedroom apartments shown on the horizontal axis and mean rents for studio apartments shown on the vertical axis, and with the same scale on both axes. For each year, mean rents will be plotted as a point.From the following options, select for Horizontal axis a range for the points on the horizontal axis and select for Vertical axis a range for the points on the vertical axis that together would satisfy Maria's requirements for the graph. Make only two selections, one in each column.a)Horizontal axis - €400 to €1,100Vertical axis - €800 to €1,200b)Horizontal axis - €0 to €1,500Vertical axis - €0 to €1,500c)Horizontal axis - €1,000 to €2,300Vertical axis - €0 to €1,500d)Horizontal axis - €1,100 to €1,500Vertical axis - €400 to €1,100e)Horizontal axis - €400 to €1,100Vertical axis - €1,000 to €2,300Correct answer is option 'B'. Can you explain this answer? for GMAT 2025 is part of GMAT preparation. The Question and answers have been prepared according to the GMAT exam syllabus. Information about Throughout a certain decade in a European city, the mean monthly rents for studio apartments varied yearly, from a low of €804 to a high of €1,173. Those for one-bedroom apartments also varied yearly, from a low of €1,060 to a high of €1,497. But some individual studio apartments rented for as little as €420 in some years, and some one-bedroom apartments rented for up to €2,262. To visually assess how the ratio of mean monthly rents for studio apartments to those for one-bedroom apartments varied yearly over the decade, Maria requires a graph with the following characteristics. The graph will have two axes of equal length, with mean rents for one-bedroom apartments shown on the horizontal axis and mean rents for studio apartments shown on the vertical axis, and with the same scale on both axes. For each year, mean rents will be plotted as a point.From the following options, select for Horizontal axis a range for the points on the horizontal axis and select for Vertical axis a range for the points on the vertical axis that together would satisfy Maria's requirements for the graph. Make only two selections, one in each column.a)Horizontal axis - €400 to €1,100Vertical axis - €800 to €1,200b)Horizontal axis - €0 to €1,500Vertical axis - €0 to €1,500c)Horizontal axis - €1,000 to €2,300Vertical axis - €0 to €1,500d)Horizontal axis - €1,100 to €1,500Vertical axis - €400 to €1,100e)Horizontal axis - €400 to €1,100Vertical axis - €1,000 to €2,300Correct answer is option 'B'. Can you explain this answer? covers all topics & solutions for GMAT 2025 Exam. Find important definitions, questions, meanings, examples, exercises and tests below for Throughout a certain decade in a European city, the mean monthly rents for studio apartments varied yearly, from a low of €804 to a high of €1,173. Those for one-bedroom apartments also varied yearly, from a low of €1,060 to a high of €1,497. But some individual studio apartments rented for as little as €420 in some years, and some one-bedroom apartments rented for up to €2,262. To visually assess how the ratio of mean monthly rents for studio apartments to those for one-bedroom apartments varied yearly over the decade, Maria requires a graph with the following characteristics. The graph will have two axes of equal length, with mean rents for one-bedroom apartments shown on the horizontal axis and mean rents for studio apartments shown on the vertical axis, and with the same scale on both axes. For each year, mean rents will be plotted as a point.From the following options, select for Horizontal axis a range for the points on the horizontal axis and select for Vertical axis a range for the points on the vertical axis that together would satisfy Maria's requirements for the graph. Make only two selections, one in each column.a)Horizontal axis - €400 to €1,100Vertical axis - €800 to €1,200b)Horizontal axis - €0 to €1,500Vertical axis - €0 to €1,500c)Horizontal axis - €1,000 to €2,300Vertical axis - €0 to €1,500d)Horizontal axis - €1,100 to €1,500Vertical axis - €400 to €1,100e)Horizontal axis - €400 to €1,100Vertical axis - €1,000 to €2,300Correct answer is option 'B'. Can you explain this answer?.
Solutions for Throughout a certain decade in a European city, the mean monthly rents for studio apartments varied yearly, from a low of €804 to a high of €1,173. Those for one-bedroom apartments also varied yearly, from a low of €1,060 to a high of €1,497. But some individual studio apartments rented for as little as €420 in some years, and some one-bedroom apartments rented for up to €2,262. To visually assess how the ratio of mean monthly rents for studio apartments to those for one-bedroom apartments varied yearly over the decade, Maria requires a graph with the following characteristics. The graph will have two axes of equal length, with mean rents for one-bedroom apartments shown on the horizontal axis and mean rents for studio apartments shown on the vertical axis, and with the same scale on both axes. For each year, mean rents will be plotted as a point.From the following options, select for Horizontal axis a range for the points on the horizontal axis and select for Vertical axis a range for the points on the vertical axis that together would satisfy Maria's requirements for the graph. Make only two selections, one in each column.a)Horizontal axis - €400 to €1,100Vertical axis - €800 to €1,200b)Horizontal axis - €0 to €1,500Vertical axis - €0 to €1,500c)Horizontal axis - €1,000 to €2,300Vertical axis - €0 to €1,500d)Horizontal axis - €1,100 to €1,500Vertical axis - €400 to €1,100e)Horizontal axis - €400 to €1,100Vertical axis - €1,000 to €2,300Correct answer is option 'B'. Can you explain this answer? in English & in Hindi are available as part of our courses for GMAT.
Download more important topics, notes, lectures and mock test series for GMAT Exam by signing up for free.
Here you can find the meaning of Throughout a certain decade in a European city, the mean monthly rents for studio apartments varied yearly, from a low of €804 to a high of €1,173. Those for one-bedroom apartments also varied yearly, from a low of €1,060 to a high of €1,497. But some individual studio apartments rented for as little as €420 in some years, and some one-bedroom apartments rented for up to €2,262. To visually assess how the ratio of mean monthly rents for studio apartments to those for one-bedroom apartments varied yearly over the decade, Maria requires a graph with the following characteristics. The graph will have two axes of equal length, with mean rents for one-bedroom apartments shown on the horizontal axis and mean rents for studio apartments shown on the vertical axis, and with the same scale on both axes. For each year, mean rents will be plotted as a point.From the following options, select for Horizontal axis a range for the points on the horizontal axis and select for Vertical axis a range for the points on the vertical axis that together would satisfy Maria's requirements for the graph. Make only two selections, one in each column.a)Horizontal axis - €400 to €1,100Vertical axis - €800 to €1,200b)Horizontal axis - €0 to €1,500Vertical axis - €0 to €1,500c)Horizontal axis - €1,000 to €2,300Vertical axis - €0 to €1,500d)Horizontal axis - €1,100 to €1,500Vertical axis - €400 to €1,100e)Horizontal axis - €400 to €1,100Vertical axis - €1,000 to €2,300Correct answer is option 'B'. Can you explain this answer? defined & explained in the simplest way possible. Besides giving the explanation of
Throughout a certain decade in a European city, the mean monthly rents for studio apartments varied yearly, from a low of €804 to a high of €1,173. Those for one-bedroom apartments also varied yearly, from a low of €1,060 to a high of €1,497. But some individual studio apartments rented for as little as €420 in some years, and some one-bedroom apartments rented for up to €2,262. To visually assess how the ratio of mean monthly rents for studio apartments to those for one-bedroom apartments varied yearly over the decade, Maria requires a graph with the following characteristics. The graph will have two axes of equal length, with mean rents for one-bedroom apartments shown on the horizontal axis and mean rents for studio apartments shown on the vertical axis, and with the same scale on both axes. For each year, mean rents will be plotted as a point.From the following options, select for Horizontal axis a range for the points on the horizontal axis and select for Vertical axis a range for the points on the vertical axis that together would satisfy Maria's requirements for the graph. Make only two selections, one in each column.a)Horizontal axis - €400 to €1,100Vertical axis - €800 to €1,200b)Horizontal axis - €0 to €1,500Vertical axis - €0 to €1,500c)Horizontal axis - €1,000 to €2,300Vertical axis - €0 to €1,500d)Horizontal axis - €1,100 to €1,500Vertical axis - €400 to €1,100e)Horizontal axis - €400 to €1,100Vertical axis - €1,000 to €2,300Correct answer is option 'B'. Can you explain this answer?, a detailed solution for Throughout a certain decade in a European city, the mean monthly rents for studio apartments varied yearly, from a low of €804 to a high of €1,173. Those for one-bedroom apartments also varied yearly, from a low of €1,060 to a high of €1,497. But some individual studio apartments rented for as little as €420 in some years, and some one-bedroom apartments rented for up to €2,262. To visually assess how the ratio of mean monthly rents for studio apartments to those for one-bedroom apartments varied yearly over the decade, Maria requires a graph with the following characteristics. The graph will have two axes of equal length, with mean rents for one-bedroom apartments shown on the horizontal axis and mean rents for studio apartments shown on the vertical axis, and with the same scale on both axes. For each year, mean rents will be plotted as a point.From the following options, select for Horizontal axis a range for the points on the horizontal axis and select for Vertical axis a range for the points on the vertical axis that together would satisfy Maria's requirements for the graph. Make only two selections, one in each column.a)Horizontal axis - €400 to €1,100Vertical axis - €800 to €1,200b)Horizontal axis - €0 to €1,500Vertical axis - €0 to €1,500c)Horizontal axis - €1,000 to €2,300Vertical axis - €0 to €1,500d)Horizontal axis - €1,100 to €1,500Vertical axis - €400 to €1,100e)Horizontal axis - €400 to €1,100Vertical axis - €1,000 to €2,300Correct answer is option 'B'. Can you explain this answer? has been provided alongside types of Throughout a certain decade in a European city, the mean monthly rents for studio apartments varied yearly, from a low of €804 to a high of €1,173. Those for one-bedroom apartments also varied yearly, from a low of €1,060 to a high of €1,497. But some individual studio apartments rented for as little as €420 in some years, and some one-bedroom apartments rented for up to €2,262. To visually assess how the ratio of mean monthly rents for studio apartments to those for one-bedroom apartments varied yearly over the decade, Maria requires a graph with the following characteristics. The graph will have two axes of equal length, with mean rents for one-bedroom apartments shown on the horizontal axis and mean rents for studio apartments shown on the vertical axis, and with the same scale on both axes. For each year, mean rents will be plotted as a point.From the following options, select for Horizontal axis a range for the points on the horizontal axis and select for Vertical axis a range for the points on the vertical axis that together would satisfy Maria's requirements for the graph. Make only two selections, one in each column.a)Horizontal axis - €400 to €1,100Vertical axis - €800 to €1,200b)Horizontal axis - €0 to €1,500Vertical axis - €0 to €1,500c)Horizontal axis - €1,000 to €2,300Vertical axis - €0 to €1,500d)Horizontal axis - €1,100 to €1,500Vertical axis - €400 to €1,100e)Horizontal axis - €400 to €1,100Vertical axis - €1,000 to €2,300Correct answer is option 'B'. Can you explain this answer? theory, EduRev gives you an
ample number of questions to practice Throughout a certain decade in a European city, the mean monthly rents for studio apartments varied yearly, from a low of €804 to a high of €1,173. Those for one-bedroom apartments also varied yearly, from a low of €1,060 to a high of €1,497. But some individual studio apartments rented for as little as €420 in some years, and some one-bedroom apartments rented for up to €2,262. To visually assess how the ratio of mean monthly rents for studio apartments to those for one-bedroom apartments varied yearly over the decade, Maria requires a graph with the following characteristics. The graph will have two axes of equal length, with mean rents for one-bedroom apartments shown on the horizontal axis and mean rents for studio apartments shown on the vertical axis, and with the same scale on both axes. For each year, mean rents will be plotted as a point.From the following options, select for Horizontal axis a range for the points on the horizontal axis and select for Vertical axis a range for the points on the vertical axis that together would satisfy Maria's requirements for the graph. Make only two selections, one in each column.a)Horizontal axis - €400 to €1,100Vertical axis - €800 to €1,200b)Horizontal axis - €0 to €1,500Vertical axis - €0 to €1,500c)Horizontal axis - €1,000 to €2,300Vertical axis - €0 to €1,500d)Horizontal axis - €1,100 to €1,500Vertical axis - €400 to €1,100e)Horizontal axis - €400 to €1,100Vertical axis - €1,000 to €2,300Correct answer is option 'B'. Can you explain this answer? tests, examples and also practice GMAT tests.
|
|
Explore Courses for GMAT exam
|
|

Signup for Free!
Signup to see your scores go up within 7 days! Learn & Practice with 1000+ FREE Notes, Videos & Tests.


|
© EduRev
|
Education Revolution
|


|


Signup to see your scores
go up within 7 days!
Access 1000+ FREE Docs, Videos and Tests
Takes less than 10 seconds to signup