


GMAT Exam > GMAT Questions > Based on a study of a 10,000 person sample of...
Start Learning for Free
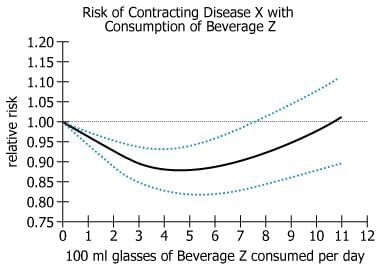
Based on a study of a 10,000 person sample of the adult population of Country Y, the unbroken curve on the graph plots an association between daily consumption of various amounts of Beverage Z and the relative risk of contracting Disease X compared to the risk with no consumption of Beverage Z (indicated by 1.00). For the entire adult population of Country Y, the relative-risk values could—because of sampling error—be either higher or lower than for the particular 10,000 person sample studied. Thus the two broken lines show the estimates of how high or how low those relative-risk values for that population could be.
Choose the options that create the statement that is most strongly supported by the information provided.
Compared to the risk with no consumption of Beverage Z, the reduction in relative risk of contracting Disease X for adults of Country Y is ____(A)_____ when the daily consumption of Beverage Z is in the range of ____(B)_____ 100 mg glasses.
- a)(A)- Greatest,(B)- 1-3
- b)(A)- unchanged, (B)- 4-6
- c)(A)- Least, (B)- 1-3
- d)(A)- Least, (B)- 7-8
- e)(A)- Greatest,(B)- 4-6
Correct answer is option 'E'. Can you explain this answer?

Most Upvoted Answer
Based on a study of a 10,000 person sample of the adult population of ...
The question talks of comparison on relative risk with no consumption of a beverage and some consuption of the beverage, so we are dealing with the straight line vs the curved line.
The first blank talks of this relation and the options are:
Unchanged: For unchanged, the two lines, straight and curved, should be superimposed on each other. But that is not the situation anywhere on the line graph. Discard. (Although the lines intersect at a certain time, but the second blank talks of range of number of glasses).
Least: Least reduction will be when the two lines are close to each other.
Greatest: Greatest reduction will be when the curved line is the farthest from staright line
Let us now, relate least and greatest with second blank.
1-3: It is not the lowest or greatest as the curved line is sloping downwards ( moves from 0.97 to 0.90), so reduction is neither the least nor the greatest.
4-6: The curved line flattens at this location and is at the lowest point 0.90-0.92, so the reduction is the greatest in this range.
7-8: The curved line moves upwards from 0.93 to 0.95, thus neither the least nor the greatest.
Correct combination:
1. Greatest
2. 4-6
1. Greatest
2. 4-6

|
Explore Courses for GMAT exam
|
|
Top Courses for GMATView all


Question Description
Based on a study of a 10,000 person sample of the adult population of Country Y, the unbroken curve on the graph plots an association between daily consumption of various amounts of Beverage Z and the relative risk of contracting Disease X compared to the risk with no consumption of Beverage Z (indicated by 1.00). For the entire adult population of Country Y, the relative-risk values could—because of sampling error—be either higher or lower than for the particular 10,000 person sample studied. Thus the two broken lines show the estimates of how high or how low those relative-risk values for that population could be.Choose the options that create the statement that is most strongly supported by the information provided.Compared to the risk with no consumption of Beverage Z, the reduction in relative risk of contracting Disease X for adults of Country Y is ____(A)_____when the daily consumption of Beverage Z is in the range of ____(B)_____100 mg glasses.a)(A)- Greatest,(B)- 1-3b)(A)- unchanged, (B)- 4-6c)(A)- Least, (B)- 1-3d)(A)- Least, (B)- 7-8e)(A)- Greatest,(B)- 4-6Correct answer is option 'E'. Can you explain this answer? for GMAT 2025 is part of GMAT preparation. The Question and answers have been prepared according to the GMAT exam syllabus. Information about Based on a study of a 10,000 person sample of the adult population of Country Y, the unbroken curve on the graph plots an association between daily consumption of various amounts of Beverage Z and the relative risk of contracting Disease X compared to the risk with no consumption of Beverage Z (indicated by 1.00). For the entire adult population of Country Y, the relative-risk values could—because of sampling error—be either higher or lower than for the particular 10,000 person sample studied. Thus the two broken lines show the estimates of how high or how low those relative-risk values for that population could be.Choose the options that create the statement that is most strongly supported by the information provided.Compared to the risk with no consumption of Beverage Z, the reduction in relative risk of contracting Disease X for adults of Country Y is ____(A)_____when the daily consumption of Beverage Z is in the range of ____(B)_____100 mg glasses.a)(A)- Greatest,(B)- 1-3b)(A)- unchanged, (B)- 4-6c)(A)- Least, (B)- 1-3d)(A)- Least, (B)- 7-8e)(A)- Greatest,(B)- 4-6Correct answer is option 'E'. Can you explain this answer? covers all topics & solutions for GMAT 2025 Exam. Find important definitions, questions, meanings, examples, exercises and tests below for Based on a study of a 10,000 person sample of the adult population of Country Y, the unbroken curve on the graph plots an association between daily consumption of various amounts of Beverage Z and the relative risk of contracting Disease X compared to the risk with no consumption of Beverage Z (indicated by 1.00). For the entire adult population of Country Y, the relative-risk values could—because of sampling error—be either higher or lower than for the particular 10,000 person sample studied. Thus the two broken lines show the estimates of how high or how low those relative-risk values for that population could be.Choose the options that create the statement that is most strongly supported by the information provided.Compared to the risk with no consumption of Beverage Z, the reduction in relative risk of contracting Disease X for adults of Country Y is ____(A)_____when the daily consumption of Beverage Z is in the range of ____(B)_____100 mg glasses.a)(A)- Greatest,(B)- 1-3b)(A)- unchanged, (B)- 4-6c)(A)- Least, (B)- 1-3d)(A)- Least, (B)- 7-8e)(A)- Greatest,(B)- 4-6Correct answer is option 'E'. Can you explain this answer?.
Based on a study of a 10,000 person sample of the adult population of Country Y, the unbroken curve on the graph plots an association between daily consumption of various amounts of Beverage Z and the relative risk of contracting Disease X compared to the risk with no consumption of Beverage Z (indicated by 1.00). For the entire adult population of Country Y, the relative-risk values could—because of sampling error—be either higher or lower than for the particular 10,000 person sample studied. Thus the two broken lines show the estimates of how high or how low those relative-risk values for that population could be.Choose the options that create the statement that is most strongly supported by the information provided.Compared to the risk with no consumption of Beverage Z, the reduction in relative risk of contracting Disease X for adults of Country Y is ____(A)_____when the daily consumption of Beverage Z is in the range of ____(B)_____100 mg glasses.a)(A)- Greatest,(B)- 1-3b)(A)- unchanged, (B)- 4-6c)(A)- Least, (B)- 1-3d)(A)- Least, (B)- 7-8e)(A)- Greatest,(B)- 4-6Correct answer is option 'E'. Can you explain this answer? for GMAT 2025 is part of GMAT preparation. The Question and answers have been prepared according to the GMAT exam syllabus. Information about Based on a study of a 10,000 person sample of the adult population of Country Y, the unbroken curve on the graph plots an association between daily consumption of various amounts of Beverage Z and the relative risk of contracting Disease X compared to the risk with no consumption of Beverage Z (indicated by 1.00). For the entire adult population of Country Y, the relative-risk values could—because of sampling error—be either higher or lower than for the particular 10,000 person sample studied. Thus the two broken lines show the estimates of how high or how low those relative-risk values for that population could be.Choose the options that create the statement that is most strongly supported by the information provided.Compared to the risk with no consumption of Beverage Z, the reduction in relative risk of contracting Disease X for adults of Country Y is ____(A)_____when the daily consumption of Beverage Z is in the range of ____(B)_____100 mg glasses.a)(A)- Greatest,(B)- 1-3b)(A)- unchanged, (B)- 4-6c)(A)- Least, (B)- 1-3d)(A)- Least, (B)- 7-8e)(A)- Greatest,(B)- 4-6Correct answer is option 'E'. Can you explain this answer? covers all topics & solutions for GMAT 2025 Exam. Find important definitions, questions, meanings, examples, exercises and tests below for Based on a study of a 10,000 person sample of the adult population of Country Y, the unbroken curve on the graph plots an association between daily consumption of various amounts of Beverage Z and the relative risk of contracting Disease X compared to the risk with no consumption of Beverage Z (indicated by 1.00). For the entire adult population of Country Y, the relative-risk values could—because of sampling error—be either higher or lower than for the particular 10,000 person sample studied. Thus the two broken lines show the estimates of how high or how low those relative-risk values for that population could be.Choose the options that create the statement that is most strongly supported by the information provided.Compared to the risk with no consumption of Beverage Z, the reduction in relative risk of contracting Disease X for adults of Country Y is ____(A)_____when the daily consumption of Beverage Z is in the range of ____(B)_____100 mg glasses.a)(A)- Greatest,(B)- 1-3b)(A)- unchanged, (B)- 4-6c)(A)- Least, (B)- 1-3d)(A)- Least, (B)- 7-8e)(A)- Greatest,(B)- 4-6Correct answer is option 'E'. Can you explain this answer?.
Solutions for Based on a study of a 10,000 person sample of the adult population of Country Y, the unbroken curve on the graph plots an association between daily consumption of various amounts of Beverage Z and the relative risk of contracting Disease X compared to the risk with no consumption of Beverage Z (indicated by 1.00). For the entire adult population of Country Y, the relative-risk values could—because of sampling error—be either higher or lower than for the particular 10,000 person sample studied. Thus the two broken lines show the estimates of how high or how low those relative-risk values for that population could be.Choose the options that create the statement that is most strongly supported by the information provided.Compared to the risk with no consumption of Beverage Z, the reduction in relative risk of contracting Disease X for adults of Country Y is ____(A)_____when the daily consumption of Beverage Z is in the range of ____(B)_____100 mg glasses.a)(A)- Greatest,(B)- 1-3b)(A)- unchanged, (B)- 4-6c)(A)- Least, (B)- 1-3d)(A)- Least, (B)- 7-8e)(A)- Greatest,(B)- 4-6Correct answer is option 'E'. Can you explain this answer? in English & in Hindi are available as part of our courses for GMAT.
Download more important topics, notes, lectures and mock test series for GMAT Exam by signing up for free.
Here you can find the meaning of Based on a study of a 10,000 person sample of the adult population of Country Y, the unbroken curve on the graph plots an association between daily consumption of various amounts of Beverage Z and the relative risk of contracting Disease X compared to the risk with no consumption of Beverage Z (indicated by 1.00). For the entire adult population of Country Y, the relative-risk values could—because of sampling error—be either higher or lower than for the particular 10,000 person sample studied. Thus the two broken lines show the estimates of how high or how low those relative-risk values for that population could be.Choose the options that create the statement that is most strongly supported by the information provided.Compared to the risk with no consumption of Beverage Z, the reduction in relative risk of contracting Disease X for adults of Country Y is ____(A)_____when the daily consumption of Beverage Z is in the range of ____(B)_____100 mg glasses.a)(A)- Greatest,(B)- 1-3b)(A)- unchanged, (B)- 4-6c)(A)- Least, (B)- 1-3d)(A)- Least, (B)- 7-8e)(A)- Greatest,(B)- 4-6Correct answer is option 'E'. Can you explain this answer? defined & explained in the simplest way possible. Besides giving the explanation of
Based on a study of a 10,000 person sample of the adult population of Country Y, the unbroken curve on the graph plots an association between daily consumption of various amounts of Beverage Z and the relative risk of contracting Disease X compared to the risk with no consumption of Beverage Z (indicated by 1.00). For the entire adult population of Country Y, the relative-risk values could—because of sampling error—be either higher or lower than for the particular 10,000 person sample studied. Thus the two broken lines show the estimates of how high or how low those relative-risk values for that population could be.Choose the options that create the statement that is most strongly supported by the information provided.Compared to the risk with no consumption of Beverage Z, the reduction in relative risk of contracting Disease X for adults of Country Y is ____(A)_____when the daily consumption of Beverage Z is in the range of ____(B)_____100 mg glasses.a)(A)- Greatest,(B)- 1-3b)(A)- unchanged, (B)- 4-6c)(A)- Least, (B)- 1-3d)(A)- Least, (B)- 7-8e)(A)- Greatest,(B)- 4-6Correct answer is option 'E'. Can you explain this answer?, a detailed solution for Based on a study of a 10,000 person sample of the adult population of Country Y, the unbroken curve on the graph plots an association between daily consumption of various amounts of Beverage Z and the relative risk of contracting Disease X compared to the risk with no consumption of Beverage Z (indicated by 1.00). For the entire adult population of Country Y, the relative-risk values could—because of sampling error—be either higher or lower than for the particular 10,000 person sample studied. Thus the two broken lines show the estimates of how high or how low those relative-risk values for that population could be.Choose the options that create the statement that is most strongly supported by the information provided.Compared to the risk with no consumption of Beverage Z, the reduction in relative risk of contracting Disease X for adults of Country Y is ____(A)_____when the daily consumption of Beverage Z is in the range of ____(B)_____100 mg glasses.a)(A)- Greatest,(B)- 1-3b)(A)- unchanged, (B)- 4-6c)(A)- Least, (B)- 1-3d)(A)- Least, (B)- 7-8e)(A)- Greatest,(B)- 4-6Correct answer is option 'E'. Can you explain this answer? has been provided alongside types of Based on a study of a 10,000 person sample of the adult population of Country Y, the unbroken curve on the graph plots an association between daily consumption of various amounts of Beverage Z and the relative risk of contracting Disease X compared to the risk with no consumption of Beverage Z (indicated by 1.00). For the entire adult population of Country Y, the relative-risk values could—because of sampling error—be either higher or lower than for the particular 10,000 person sample studied. Thus the two broken lines show the estimates of how high or how low those relative-risk values for that population could be.Choose the options that create the statement that is most strongly supported by the information provided.Compared to the risk with no consumption of Beverage Z, the reduction in relative risk of contracting Disease X for adults of Country Y is ____(A)_____when the daily consumption of Beverage Z is in the range of ____(B)_____100 mg glasses.a)(A)- Greatest,(B)- 1-3b)(A)- unchanged, (B)- 4-6c)(A)- Least, (B)- 1-3d)(A)- Least, (B)- 7-8e)(A)- Greatest,(B)- 4-6Correct answer is option 'E'. Can you explain this answer? theory, EduRev gives you an
ample number of questions to practice Based on a study of a 10,000 person sample of the adult population of Country Y, the unbroken curve on the graph plots an association between daily consumption of various amounts of Beverage Z and the relative risk of contracting Disease X compared to the risk with no consumption of Beverage Z (indicated by 1.00). For the entire adult population of Country Y, the relative-risk values could—because of sampling error—be either higher or lower than for the particular 10,000 person sample studied. Thus the two broken lines show the estimates of how high or how low those relative-risk values for that population could be.Choose the options that create the statement that is most strongly supported by the information provided.Compared to the risk with no consumption of Beverage Z, the reduction in relative risk of contracting Disease X for adults of Country Y is ____(A)_____when the daily consumption of Beverage Z is in the range of ____(B)_____100 mg glasses.a)(A)- Greatest,(B)- 1-3b)(A)- unchanged, (B)- 4-6c)(A)- Least, (B)- 1-3d)(A)- Least, (B)- 7-8e)(A)- Greatest,(B)- 4-6Correct answer is option 'E'. Can you explain this answer? tests, examples and also practice GMAT tests.
|
|
Explore Courses for GMAT exam
|
|

Signup for Free!
Signup to see your scores go up within 7 days! Learn & Practice with 1000+ FREE Notes, Videos & Tests.


|
© EduRev
|
Education Revolution
|


|


Signup to see your scores
go up within 7 days!
Access 1000+ FREE Docs, Videos and Tests
Takes less than 10 seconds to signup