


CAT Exam > CAT Questions > The bar graph given below shows the percentag...
Start Learning for Free
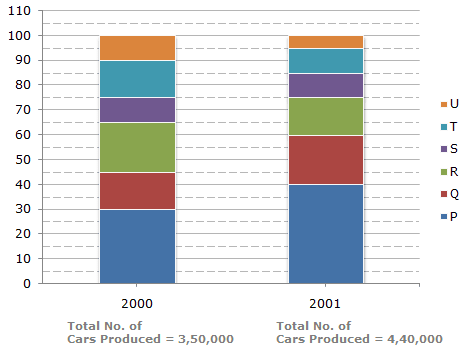
The bar graph given below shows the percentage distribution of the total production of a car manufacturing company into various models over two years.
Percentage of Six different types of Cars manufactured by a Company over Two Years
Percentage of Six different types of Cars manufactured by a Company over Two Years
What was the difference in the number of Q type cars produced in 2000 and that produced in 2001?
- a)35,500
- b)27,000
- c)22,500
- d)17,500
Correct answer is option 'A'. Can you explain this answer?

Most Upvoted Answer
The bar graph given below shows the percentage distribution of the tot...
Total number of Q type cars produced in 2001
= (60 - 40)% of 4,40,000 = 88,000.
Total number of Q type cars produced in 2000
= (45 - 30)% of 3,50,000 = 52,500.
∴ Required difference = (88000 - 52500) = 35,500.

|
Explore Courses for CAT exam
|
|
Top Courses for CATView all


Question Description
The bar graph given below shows the percentage distribution of the total production of a car manufacturing company into various models over two years.Percentage of Six different types of Cars manufactured by a Company over Two YearsWhat was the difference in the number of Q type cars produced in 2000 and that produced in 2001?a)35,500b)27,000c)22,500d)17,500Correct answer is option 'A'. Can you explain this answer? for CAT 2025 is part of CAT preparation. The Question and answers have been prepared according to the CAT exam syllabus. Information about The bar graph given below shows the percentage distribution of the total production of a car manufacturing company into various models over two years.Percentage of Six different types of Cars manufactured by a Company over Two YearsWhat was the difference in the number of Q type cars produced in 2000 and that produced in 2001?a)35,500b)27,000c)22,500d)17,500Correct answer is option 'A'. Can you explain this answer? covers all topics & solutions for CAT 2025 Exam. Find important definitions, questions, meanings, examples, exercises and tests below for The bar graph given below shows the percentage distribution of the total production of a car manufacturing company into various models over two years.Percentage of Six different types of Cars manufactured by a Company over Two YearsWhat was the difference in the number of Q type cars produced in 2000 and that produced in 2001?a)35,500b)27,000c)22,500d)17,500Correct answer is option 'A'. Can you explain this answer?.
The bar graph given below shows the percentage distribution of the total production of a car manufacturing company into various models over two years.Percentage of Six different types of Cars manufactured by a Company over Two YearsWhat was the difference in the number of Q type cars produced in 2000 and that produced in 2001?a)35,500b)27,000c)22,500d)17,500Correct answer is option 'A'. Can you explain this answer? for CAT 2025 is part of CAT preparation. The Question and answers have been prepared according to the CAT exam syllabus. Information about The bar graph given below shows the percentage distribution of the total production of a car manufacturing company into various models over two years.Percentage of Six different types of Cars manufactured by a Company over Two YearsWhat was the difference in the number of Q type cars produced in 2000 and that produced in 2001?a)35,500b)27,000c)22,500d)17,500Correct answer is option 'A'. Can you explain this answer? covers all topics & solutions for CAT 2025 Exam. Find important definitions, questions, meanings, examples, exercises and tests below for The bar graph given below shows the percentage distribution of the total production of a car manufacturing company into various models over two years.Percentage of Six different types of Cars manufactured by a Company over Two YearsWhat was the difference in the number of Q type cars produced in 2000 and that produced in 2001?a)35,500b)27,000c)22,500d)17,500Correct answer is option 'A'. Can you explain this answer?.
Solutions for The bar graph given below shows the percentage distribution of the total production of a car manufacturing company into various models over two years.Percentage of Six different types of Cars manufactured by a Company over Two YearsWhat was the difference in the number of Q type cars produced in 2000 and that produced in 2001?a)35,500b)27,000c)22,500d)17,500Correct answer is option 'A'. Can you explain this answer? in English & in Hindi are available as part of our courses for CAT.
Download more important topics, notes, lectures and mock test series for CAT Exam by signing up for free.
Here you can find the meaning of The bar graph given below shows the percentage distribution of the total production of a car manufacturing company into various models over two years.Percentage of Six different types of Cars manufactured by a Company over Two YearsWhat was the difference in the number of Q type cars produced in 2000 and that produced in 2001?a)35,500b)27,000c)22,500d)17,500Correct answer is option 'A'. Can you explain this answer? defined & explained in the simplest way possible. Besides giving the explanation of
The bar graph given below shows the percentage distribution of the total production of a car manufacturing company into various models over two years.Percentage of Six different types of Cars manufactured by a Company over Two YearsWhat was the difference in the number of Q type cars produced in 2000 and that produced in 2001?a)35,500b)27,000c)22,500d)17,500Correct answer is option 'A'. Can you explain this answer?, a detailed solution for The bar graph given below shows the percentage distribution of the total production of a car manufacturing company into various models over two years.Percentage of Six different types of Cars manufactured by a Company over Two YearsWhat was the difference in the number of Q type cars produced in 2000 and that produced in 2001?a)35,500b)27,000c)22,500d)17,500Correct answer is option 'A'. Can you explain this answer? has been provided alongside types of The bar graph given below shows the percentage distribution of the total production of a car manufacturing company into various models over two years.Percentage of Six different types of Cars manufactured by a Company over Two YearsWhat was the difference in the number of Q type cars produced in 2000 and that produced in 2001?a)35,500b)27,000c)22,500d)17,500Correct answer is option 'A'. Can you explain this answer? theory, EduRev gives you an
ample number of questions to practice The bar graph given below shows the percentage distribution of the total production of a car manufacturing company into various models over two years.Percentage of Six different types of Cars manufactured by a Company over Two YearsWhat was the difference in the number of Q type cars produced in 2000 and that produced in 2001?a)35,500b)27,000c)22,500d)17,500Correct answer is option 'A'. Can you explain this answer? tests, examples and also practice CAT tests.
|
|
Explore Courses for CAT exam
|
|

Signup for Free!
Signup to see your scores go up within 7 days! Learn & Practice with 1000+ FREE Notes, Videos & Tests.
|
© EduRev
|
Education Revolution
|


|


Signup to see your scores
go up within 7 days!
Access 1000+ FREE Docs, Videos and Tests
Takes less than 10 seconds to signup