


Class 9 Exam > Class 9 Questions > what is the graphical derivation of first equ...
Start Learning for Free
what is the graphical derivation of first equation of motion🤔?

Most Upvoted Answer
what is the graphical derivation of first equation of motion🤔?
Community Answer
what is the graphical derivation of first equation of motion🤔?
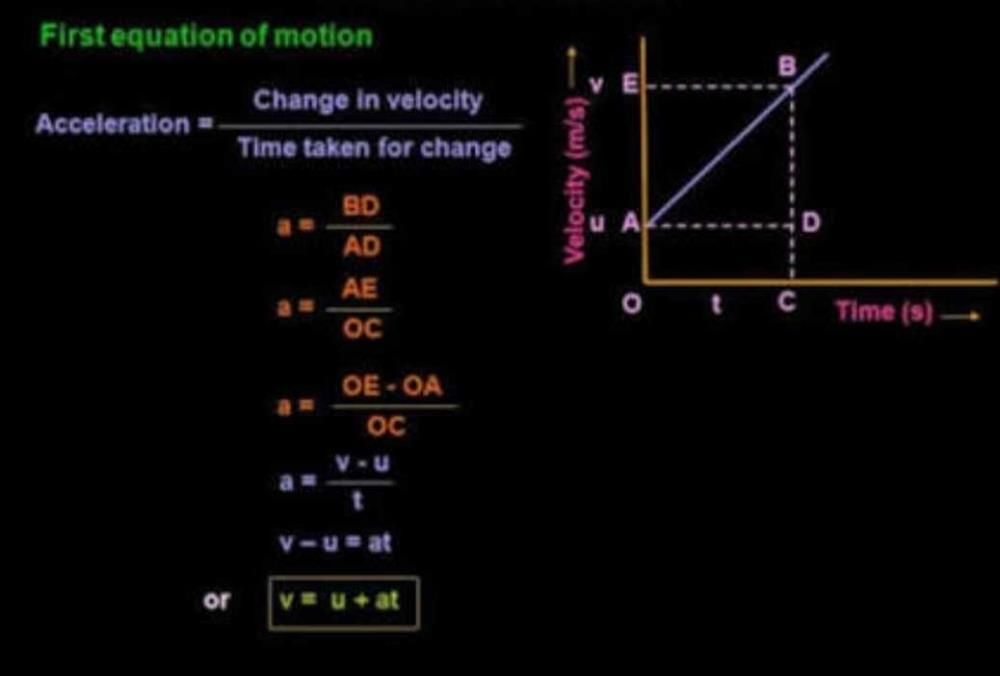
Graphical Derivation of First Equation of Motion
The first equation of motion can be derived graphically by analyzing the velocity-time graph of an object in motion.
Key Steps:
- Start by plotting a velocity-time graph with time on the x-axis and velocity on the y-axis.
- The slope of the graph represents the acceleration of the object.
- The area under the graph represents the displacement of the object.
Explanation:
- Initially, the object is at rest with a velocity of 0 m/s.
- As time progresses, the velocity of the object increases linearly with time, indicating a constant acceleration.
- The slope of the graph gives the acceleration, which is constant in this case.
- The equation of motion can be derived from the slope of the graph, which gives the acceleration as a function of time.
By analyzing the velocity-time graph, we can derive the first equation of motion which relates initial velocity, acceleration, time, and displacement of an object in motion. This graphical derivation provides a visual representation of the relationship between velocity, time, and displacement, helping us understand the motion of objects more intuitively.

|
Explore Courses for Class 9 exam
|
|
Similar Class 9 Doubts


Top Courses for Class 9View all


Question Description
what is the graphical derivation of first equation of motion🤔? for Class 9 2025 is part of Class 9 preparation. The Question and answers have been prepared according to the Class 9 exam syllabus. Information about what is the graphical derivation of first equation of motion🤔? covers all topics & solutions for Class 9 2025 Exam. Find important definitions, questions, meanings, examples, exercises and tests below for what is the graphical derivation of first equation of motion🤔?.
what is the graphical derivation of first equation of motion🤔? for Class 9 2025 is part of Class 9 preparation. The Question and answers have been prepared according to the Class 9 exam syllabus. Information about what is the graphical derivation of first equation of motion🤔? covers all topics & solutions for Class 9 2025 Exam. Find important definitions, questions, meanings, examples, exercises and tests below for what is the graphical derivation of first equation of motion🤔?.
Solutions for what is the graphical derivation of first equation of motion🤔? in English & in Hindi are available as part of our courses for Class 9.
Download more important topics, notes, lectures and mock test series for Class 9 Exam by signing up for free.
Here you can find the meaning of what is the graphical derivation of first equation of motion🤔? defined & explained in the simplest way possible. Besides giving the explanation of
what is the graphical derivation of first equation of motion🤔?, a detailed solution for what is the graphical derivation of first equation of motion🤔? has been provided alongside types of what is the graphical derivation of first equation of motion🤔? theory, EduRev gives you an
ample number of questions to practice what is the graphical derivation of first equation of motion🤔? tests, examples and also practice Class 9 tests.
|
|
Explore Courses for Class 9 exam
|
|

Signup to solve all Doubts
Signup to see your scores go up within 7 days! Learn & Practice with 1000+ FREE Notes, Videos & Tests.
|
© EduRev
|
Education Revolution
|


|


Signup to see your scores
go up
within 7 days!
within 7 days!
Takes less than 10 seconds to signup