


Commerce Exam > Commerce Questions > A curve which first moves upwards then downwa...
Start Learning for Free
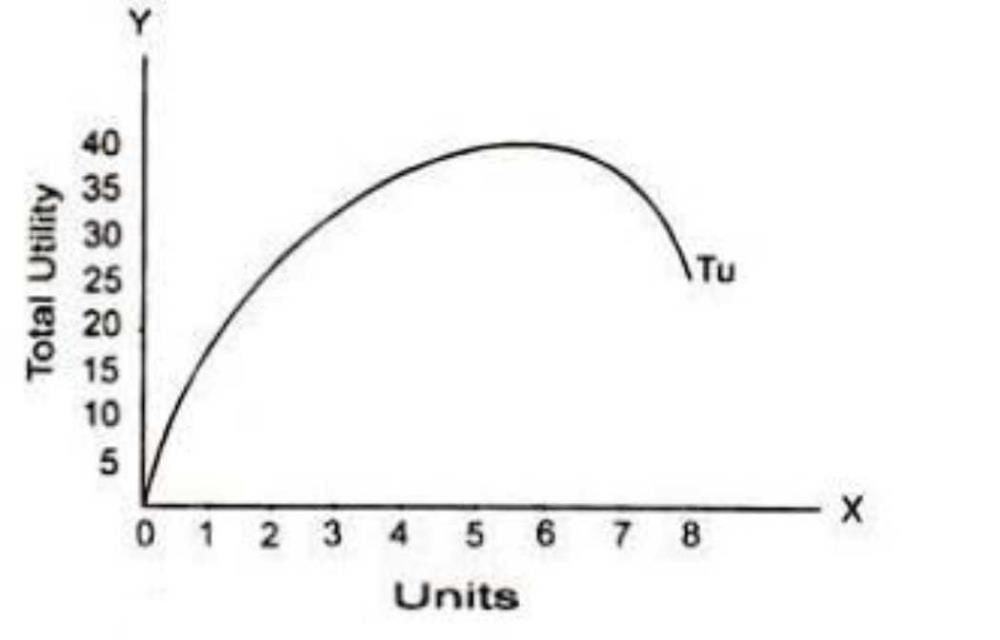
A curve which first moves upwards then downwards is__________?
- a)Total utility curve
- b)Demand curve
- c)Indifference curve
- d)Marginal utility curve
Correct answer is option 'A'. Can you explain this answer?

Verified Answer
A curve which first moves upwards then downwards is__________?a)Total ...
MU is the rate of change of TU.
When the MU decreases, TU increases at decreasing rate.
When MU becomes zero, TU is maximum. It is a saturation point.
When MU becomes negative, TU declines
Most Upvoted Answer
A curve which first moves upwards then downwards is__________?a)Total ...
Free Test
FREE
| Start Free Test |
Community Answer
A curve which first moves upwards then downwards is__________?a)Total ...
The correct answer is option 'A', the total utility curve.
Total Utility Curve:
- The total utility curve represents the relationship between the quantity of a good consumed and the total utility derived from consuming that quantity.
- It shows how the total utility changes as the quantity of a good consumed increases or decreases.
- The shape of the total utility curve depends on the law of diminishing marginal utility, which states that as a consumer consumes more units of a good, the additional satisfaction or utility derived from each additional unit decreases.
Explanation:
- When a curve first moves upwards and then downwards, it indicates that the initial consumption of the good leads to an increase in total utility, but as more units of the good are consumed, the additional utility gained starts to decrease.
- This pattern is consistent with the law of diminishing marginal utility, as the marginal utility of each additional unit of the good decreases as more units are consumed.
- Initially, the consumer experiences an increase in satisfaction or utility as they consume more units of the good, leading to an upward movement in the curve.
- However, as the consumer continues to consume more units, the additional satisfaction or utility gained from each additional unit diminishes, leading to a downward movement in the curve.
Other options explained:
- Option 'B', the demand curve, represents the relationship between the price of a good and the quantity of that good demanded by consumers. It does not describe the shape of a curve that moves upwards and then downwards.
- Option 'C', the indifference curve, represents different combinations of goods that provide the same level of satisfaction or utility to a consumer. It does not necessarily have a specific upward and downward movement.
- Option 'D', the marginal utility curve, represents the relationship between the quantity of a good consumed and the marginal utility derived from consuming that quantity. It does not describe the shape of a curve that moves upwards and then downwards.


|
Explore Courses for Commerce exam
|
|
Top Courses for CommerceView all


Question Description
A curve which first moves upwards then downwards is__________?a)Total utility curveb)Demand curvec)Indifference curved)Marginal utility curveCorrect answer is option 'A'. Can you explain this answer? for Commerce 2025 is part of Commerce preparation. The Question and answers have been prepared according to the Commerce exam syllabus. Information about A curve which first moves upwards then downwards is__________?a)Total utility curveb)Demand curvec)Indifference curved)Marginal utility curveCorrect answer is option 'A'. Can you explain this answer? covers all topics & solutions for Commerce 2025 Exam. Find important definitions, questions, meanings, examples, exercises and tests below for A curve which first moves upwards then downwards is__________?a)Total utility curveb)Demand curvec)Indifference curved)Marginal utility curveCorrect answer is option 'A'. Can you explain this answer?.
A curve which first moves upwards then downwards is__________?a)Total utility curveb)Demand curvec)Indifference curved)Marginal utility curveCorrect answer is option 'A'. Can you explain this answer? for Commerce 2025 is part of Commerce preparation. The Question and answers have been prepared according to the Commerce exam syllabus. Information about A curve which first moves upwards then downwards is__________?a)Total utility curveb)Demand curvec)Indifference curved)Marginal utility curveCorrect answer is option 'A'. Can you explain this answer? covers all topics & solutions for Commerce 2025 Exam. Find important definitions, questions, meanings, examples, exercises and tests below for A curve which first moves upwards then downwards is__________?a)Total utility curveb)Demand curvec)Indifference curved)Marginal utility curveCorrect answer is option 'A'. Can you explain this answer?.
Solutions for A curve which first moves upwards then downwards is__________?a)Total utility curveb)Demand curvec)Indifference curved)Marginal utility curveCorrect answer is option 'A'. Can you explain this answer? in English & in Hindi are available as part of our courses for Commerce.
Download more important topics, notes, lectures and mock test series for Commerce Exam by signing up for free.
Here you can find the meaning of A curve which first moves upwards then downwards is__________?a)Total utility curveb)Demand curvec)Indifference curved)Marginal utility curveCorrect answer is option 'A'. Can you explain this answer? defined & explained in the simplest way possible. Besides giving the explanation of
A curve which first moves upwards then downwards is__________?a)Total utility curveb)Demand curvec)Indifference curved)Marginal utility curveCorrect answer is option 'A'. Can you explain this answer?, a detailed solution for A curve which first moves upwards then downwards is__________?a)Total utility curveb)Demand curvec)Indifference curved)Marginal utility curveCorrect answer is option 'A'. Can you explain this answer? has been provided alongside types of A curve which first moves upwards then downwards is__________?a)Total utility curveb)Demand curvec)Indifference curved)Marginal utility curveCorrect answer is option 'A'. Can you explain this answer? theory, EduRev gives you an
ample number of questions to practice A curve which first moves upwards then downwards is__________?a)Total utility curveb)Demand curvec)Indifference curved)Marginal utility curveCorrect answer is option 'A'. Can you explain this answer? tests, examples and also practice Commerce tests.
|
|
Explore Courses for Commerce exam
|
|

Signup for Free!
Signup to see your scores go up within 7 days! Learn & Practice with 1000+ FREE Notes, Videos & Tests.
|
© EduRev
|
Education Revolution
|


|


Signup on EduRev and stay on top of your study goals
10M+ students crushing their study goals daily