Smart Charts - 1 Class 3 Worksheet Maths
Q1: The number of members in 20 families are given below:
4, 6, 5, 5, 4, 6, 3, 3, 5, 5, 3, 5, 4, 4, 6, 7, 3, 5, 5, 7
Prepare a frequency distribution of data.
Ans:
Q2: The number of students in 7 different classes is given below. Represent this data on the bar graph.
Ans: 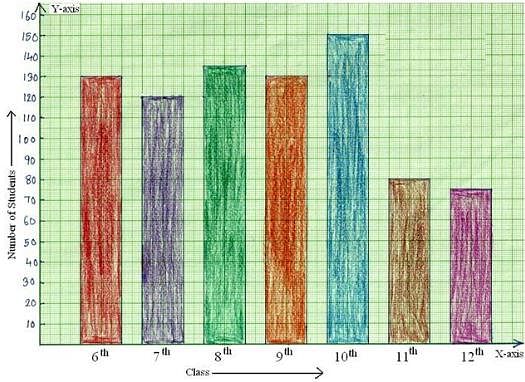
Q3: The following data gives the number of children in 40 families:
1, 2, 6, 5, 1, 5, 1, 3, 2, 6, 2, 3, 4, 2, 0, 4, 4, 3, 2, 2, 0, 0, 1, 2, 2, 4, 3, 2, 1, 0, 5, 1, 2, 4, 3, 4, 1, 6, 2, 2
Represent it in the form of a frequency distribution.
Ans:
Q4: The number of trees planted by Eco-club of a school in different years is given below.
Ans: 
Q5: The electricity bills (in dollars) of 25 houses of a certain locality for a month are given below:
324, 700, 617, 400, 356, 365, 435, 506, 548, 736, 780, 378, 570, 685, 312, 630, 584, 674, 754, 776, 596, 745, 565, 763, 472
Arrange the above data in increasing order and form a frequency table using equal class intervals, starting from 300-400, where 400 is not included.
Ans:
Q6: The following table shows the favorite sports of 300 students of a school.

Ans: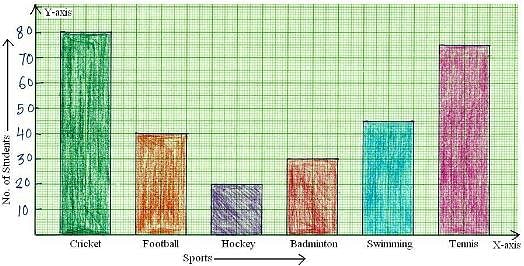
Q7: The weekly pocket expenses (in dollars) of 30 students of a class are given below:
62, 80, 110, 75, 84, 73, 60, 62, 100, 87, 78, 94, 117, 86, 65, 68, 90, 80, 118, 72, 95, 72, 103, 96, 64, 94, 87, 85, 105, 115
Construct a frequency table with class intervals 60-70 (where 70 is not included) 70-80, 80-90 etc.
Ans:
Q8: The following are the marks scored by Aaron out of 50 in different subjects in an exam. Represent this information on a bar graph
Represent this information on a bar graph.
Ans: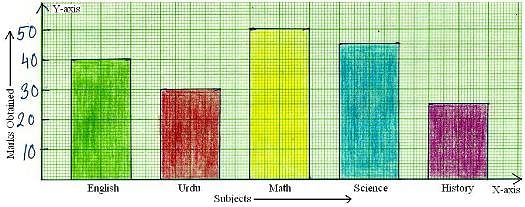
Q9: The heights (in cm) of 22 students were recorded as under:
125, 132, 138, 144, 142, 136, 134, 125, 135, 130, 126, 132, 135, 142, 143, 128, 126, 136, 135, 130, 130, 133
Prepare a frequency distribution table, taking equal class intervals and starting from 125-130, where 130 is not included.
Ans:
Q10: The following data shows the birth rate per thousand of different countries during a certain year. Draw a bar graph.
Read the questions carefully given in the worksheet on bar graph and represent the data in the column graph. The graph are shown below to check the exact the bar graph.
Ans:
Q11: A dice was thrown 30 times and the following outcomes were noted:
2, 1, 2, 4, 6, 1, 2, 3, 6, 5, 4, 4, 3, 1, 1, 3, 1, 1, 5, 6, 6, 2, 2, 3, 4, 2, 5, 5, 6, 4
Prepare a frequency table.
Ans:
Q12: The number of bed-sheets manufactured by a factory during five consecutive weeks is given below.
Ans: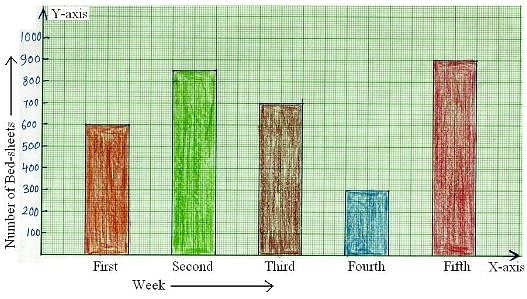
Q13: The marks obtained by 40 students of a class in an examination are given below:
8, 47, 22, 31, 17, 13, 38, 26, 3, 34, 29, 11, 22, 7, 15, 24, 38, 31, 21, 35, 42, 24, 45, 23, 21, 27, 29, 49, 25, 48, 21, 15, 18, 27, 19, 45, 14, 34, 37, 34
Prepare a frequency distribution table with equal class intervals, starting from 0-10 (where 10 is not included).
Ans:
Q14: The number of absentees in class VIII was recorded in a particular week. Represent this data on the bar graph
(a) On which day the maximum and minimum students were absent?
(b) How many students were absent on Wednesday and Friday?
(c) On which days the same number of students was absent?
Ans: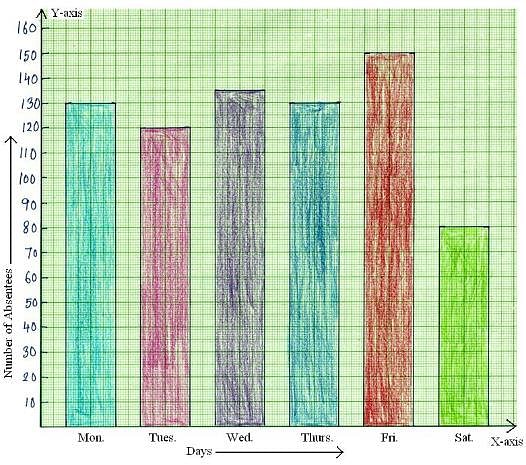
Q15: The weekly wages (in dollars) of 28 workers of a factory are given below:
668, 610, 642, 658, 668, 620, 719, 720, 700, 690, 710, 642, 672, 654, 692, 706, 718, 702, 704, 678, 615, 640, 680, 716, 705, 615, 636, 656
Construct a frequency table with equal class intervals, taking the first of the class intervals as 610-630, where 630 is not included.
Ans: 
Q16: The population of a particular state in different years is given below.
Represent the above data using the bar graph.
Ans: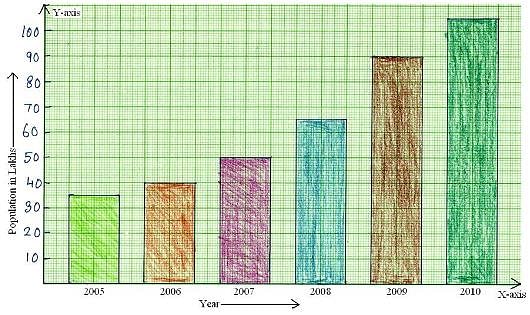
Q17: The daily earnings (in dollars) of 24 stores in a market was recorded as under:
715, 650, 685, 550, 573, 530, 610, 525, 742, 680, 736, 524, 500, 585, 723, 545, 532, 560, 580, 545, 625, 630, 645, 700
Prepare a frequency table taking equal class sizes. One such class is 500-550, where 550 is not Included.
Ans:
Q18: The following data represents the sale of refrigerator sets in a showroom in first 6 months of the year.
Ans: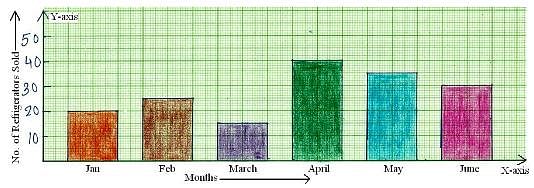
Q19: The average monthly attendance of a class is given.
Draw the bar graph of the data given.
In which month the average attendance is minimum or maximum?
In which month the average attendance was less than 40?
Find the difference between the maximum and minimum average attendance?
Ans:
|
39 videos|119 docs|55 tests
|
FAQs on Smart Charts - 1 Class 3 Worksheet Maths
| 1. What is a Smart Chart? |  |
| 2. How can Smart Charts be useful in data analysis? |  |
| 3. What are some common types of Smart Charts used in data visualization? |  |
| 4. How can I create a Smart Chart for my data? |  |
| 5. Can Smart Charts be customized to fit specific data analysis needs? |  |


