Homeostasis of Body Fluids Chapter Notes | Physiology - NEET PG PDF Download

Homeostasis
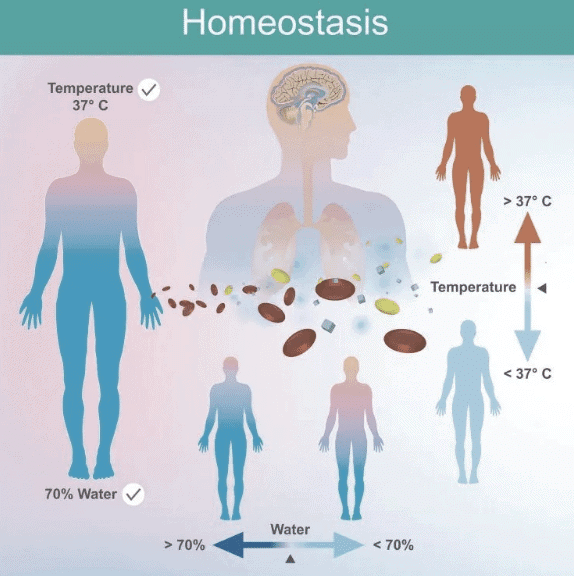
Definition: Maintenance of a constant internal environment within cells, essential for cell survival. Every cell resists change to maintain a stable internal environment.
Key Contributors:
- Walter Cannon (1929): Coined the term "homeostasis."
- Claude Bernard (1865): Introduced the concept of the internal environment, emphasizing the role of extracellular fluid (ECF), particularly interstitial fluid (ISF), termed "milieu interieur."
Purpose: Ensures normal internal cell functions by maintaining consistency in the ECF environment.
Control Systems: Detect deviations from normal and make adjustments to restore the desired value. Operated via:
Feedback Control: Output modifies the next action.
- Positive Feedback: Amplifies change (vicious cycle), leading to instability (e.g., blood clotting, ovulation, childbirth, lactation, nerve action potential, cardiac muscle contraction).
- Negative Feedback: Primary homeostatic control; reverses change to restore normalcy (e.g., baroreceptors regulate blood pressure).
Feedforward Control: Anticipates disturbances to prevent changes.
Control Systems
Positive Feedback:
- Mechanism: Amplifies ongoing change, producing more of the accumulating product.
- Outcome: Leads to instability, potentially causing death.
- Examples:
- Blood clotting.
- LH surge during ovulation.
- Uterine contractions (Ferguson reflex).
- Lactation (suckling).
- Nerve action potential generation.
- Sarcoplasmic calcium release in cardiac muscle.
Negative Feedback:
- Mechanism: Returns the controlled variable to normal by counteracting the change.
- Example: Baroreceptors reduce elevated blood pressure.
- Disadvantages:
- Incomplete compensation.
- Slow and incomplete responses (persistent error).
- Excessive feedback may cause instability.
- Loop Gain:
- Formula: Gain = Correction / Error.
- Example: If BP rises from 100 mm Hg to 175 mm Hg and corrects to 125 mm Hg:
- Correction = 175 - 125 = -50 mm Hg.
- Error = 125 - 100 = +25 mm Hg.
- Gain = -50 / +25 = -2.
Sample Question (AIIMS May 2016):
- Problem: SBP reduced by 10 mm Hg on standing, regained 8 mm Hg.
- Solution: Correction = +8 mm Hg, Error = -2 mm Hg, Gain = +8 / -2 = -4.
Feedforward Control
Mechanism: Anticipates disturbances, generating corrective commands to prevent changes in the controlled variable.
Advantages:
- Faster response.
- Eliminates steady-state errors.
- Avoids system instability.
Example: Thermoregulation.
- Central Thermoreceptors: Act as feedback sensors; if core temperature drops to 36°C, restore it to 37°C setpoint.
- Peripheral Thermoreceptors (Skin): Act as feedforward sensors; detect environmental temperature drops, initiating responses before core temperature falls.
Other Examples:
- Increased heart and respiratory rate before exercise due to psychic stimulation.
- Rapid body movements controlled by the brain via feedforward (feedback too slow).
Body Composition
Overview: Human body composition at atomic, molecular, and tissue levels.
- Atomic Level:
- Oxygen: 60%
- Carbon: 20%
- Hydrogen: 15%
- Calcium: 1%
- Others: 4%
- Molecular Level:
- Water: 60%
- Protein: 18%
- Fat: 15%
- Mineral: 6%
- Glycogen: 1%
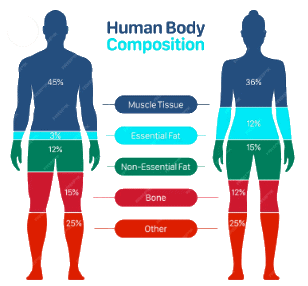
- Tissue Level:
- Skeletal muscle: 36%
- Non-skeletal: 29%
- Adipose tissue: 25%
- Bone: 10%
Body Water (as % of Body Weight):
Total Body Water (TBW): 60% (e.g., 42 L in a 70 kg man).
- Intracellular Fluid (ICF): 40% (28 L, 2/3 of TBW).
- Extracellular Fluid (ECF): 20% (14 L, 1/3 of TBW).
- Interstitial Fluid (ISF): 15% (3/4 of ECF).
- Plasma: 5% (1/4 of ECF).
Total Blood Volume: 8% (Plasma 5% + Blood cells 3%).
- Formula: Total blood volume = Plasma volume / (1 - Hematocrit).
Transcellular Fluid:
- Specialized ECF (1-2 L, 1-3% body weight).
- Includes: Pericardial (50 mL), Pleural (10-20 mL), Peritoneal (Male: none, Female: 5-20 mL), Synovial (0.5-1.5 mL per large joint, up to 100 mL in osteoarthritis), cerebrospinal, and intraocular fluids.
Mesenchymal Tissue Fluid: In dense connective tissue, cartilage, bones; ~6% of body water.
- Combined with ISF and transcellular fluid, forms 75% of ECF.
Key Notes:
- Females have ~10% less TBW due to higher adipose tissue.
- Infants have higher TBW (brain: 74-80% water, bones: 20% water) than adults, with more ECF (prone to dehydration).
- Maximum ICF is in muscles.
- At puberty, body fluid distribution matches adults, with male-female differences emerging.
Body Fluid Changes with Age
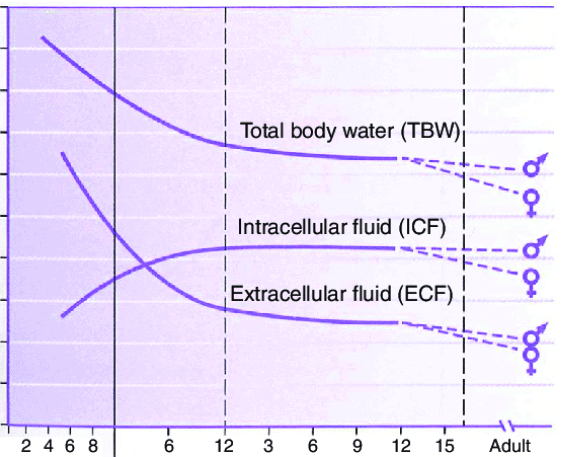
- Infants:
- Higher ECF:ICF ratio, prone to dehydration.
- Postnatal diuresis reduces ECF volume; ICF expands with growth.
- By 3-4 months, ICF = ECF; by 1 year, ICF:ECF approaches adult levels.
- By Age 2: TBW ~60% of body weight.
- Puberty: Adult-like fluid distribution; sex differences appear.
- Table 1.2: Total Body Water by Age:
- Premature infant: 90%
- Full-term newborn: 70-80%
- One year: 64%
- Puberty to 39 years: Men 64%, Women 52%
- 40-60 years: Men 55%, Women 47%
60 years: Men 52%, Women 46%
- Tissue Water Content:
- Blood: 83%
- Kidney: 82.7%
- Heart: 79.2%
- Lung: 79%
- Spleen: 75.8%
- Adipose tissue: 10% (least).
Lean Body Mass: 71-72 mL water/100 g tissue, independent of sex.
Measurement of Body Fluid
- Principle: Volume of distribution (indicator dilution).
- Formula: v = (Q - e) / C
- v = Volume of fluid
- Q = Quantity of indicator
- C = Concentration of indicator
- e = Indicator lost or metabolized
Indicators:
- Plasma Volume: Evans’ blue (T1824), 125I-albumin.
- RBC Volume: 51Cr, 59Fe, 32P, antigenic tagging.
- Total Blood Volume: Plasma volume / (1 - Hematocrit).
- ECF Volume: Inulin (most accurate), sucrose, mannitol, sodium thiosulphate, sodium thiocyanate, 22Na, 125I-iothalamate.
- Interstitial Fluid: ECF volume - Plasma volume.
- ICF: Total body water - ECF.
- Total Body Water: D2O (most frequent), tritium oxide, antipyrine.
Normal Fluid Balance
Daily Intake: 2300 mL (2100 mL ingested fluids + 200 mL from metabolism).
Daily Loss:
- Insensible: 700 mL (skin 350 mL, lungs 350 mL).
- Sweat: 100 mL.
- Feces: 100 mL.
- Urine: 1400 mL.
Minimum Water Requirement: 1.5 L/day (adult).
Shifts of Water Between Compartments
Darrow-Yannet Diagram:
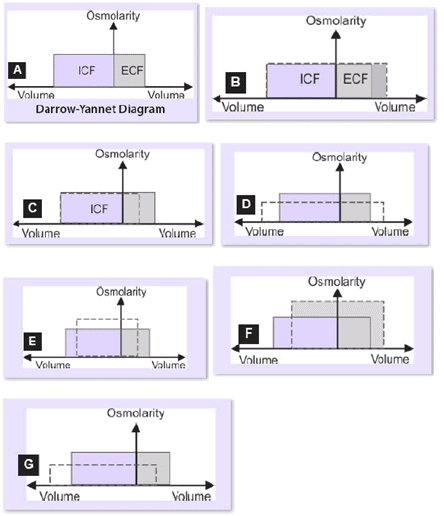
- Key Principles:
- Water moves rapidly across cell membranes; ICF and ECF osmolarities are nearly equal.
- Cell membranes are impermeable to many solutes; osmoles remain constant unless added/lost from ECF.
- Axes:
- Y-axis: Osmolality (solute concentration).
- X-axis: Volume (ICF 2/3, ECF 1/3).
- Normal State: Equal osmolality in ICF and ECF.
- Changes:
- ECF volume/osmolality changes based on solution type (isotonic, hypotonic, hypertonic).
- ICF volume varies with ECF osmolality; ICF osmolality changes inversely to volume.
Scenarios:
- Gain of Isotonic Fluid (B): Increases ECF volume, no change in osmolality or ICF volume (e.g., isotonic NaCl infusion).
- Loss of Isotonic Fluid (C): Decreases ECF volume, no change in osmolality or ICF volume (e.g., hemorrhage, diarrhea, vomiting).
- Gain of Hypotonic Fluid (D): Increases ECF volume, decreases ECF osmolality, increases ICF volume (e.g., SIADH, tap water drinking).
- Loss of Hypotonic Fluid (E): Decreases ECF volume, increases ECF osmolality, decreases ICF volume (e.g., sweating, diabetes insipidus).
- Gain of Hypertonic Fluid (F): Increases ECF volume and osmolality, decreases ICF volume (e.g., excessive NaCl, mannitol).
- Loss of Hypertonic Fluid (G): Decreases ECF volume and osmolality, increases ICF volume (e.g., adrenocortical insufficiency).
Clinical Problem:
Loss of 1 L:
- Water (Hypotonic): ICF 667 mL, ECF 333 mL.
- Isotonic NaCl: ECF 1000 mL, ICF 0 mL.
- Half-Isotonic NaCl: ECF 667 mL, ICF 333 mL.
Ionic Composition
Ionic Concentrations (mOsm/L):
- ICF:
- K+: 140 (max cation)
- Na+: 14
- Cl-: 4
- HCO3-: 10
- HPO4, H2PO4: 11 (max anion)
- Protein: 4
- Ca2+: <0.0002
- Mg2+: 20
- Osmolar activity: 281
- Osmotic pressure (37°C): 5423 mm Hg
- ISF:
- K+: 4
- Na+: 139
- Cl-: 108 (max anion)
- HCO3-: 28
- HPO4, H2PO4: 2
- Protein: 0.2
- Ca2+: 1.2
- Mg2+: 0.7
- Osmolar activity: 281
- Osmotic pressure: 5423 mm Hg
- Blood (ECF):
- K+: 4.2
- Na+: 145 (max cation)
- Cl-: 108 (max anion)
- HCO3-: 24
- HPO4, H2PO4: 2
- Protein: 1.2
- Ca2+: 1.8
- Mg2+: 1.5
- Osmolar activity: 282
- Osmotic pressure: 5443 mm Hg
Key Notes:
- Maximum Ca2+ concentration gradient (ECF:ICF ~12000:1).
- Anion differences due to intracellular molecules impermeable to cell membranes.
- Cation distribution (Na+, K+) driven by Na+-K+-ATPase pump.
Exchangeable Solutes:
- K+: 100% exchangeable.
- Na+: 65-70% exchangeable.
- Ca2+, Mg2+: Mostly nonexchangeable.
Body Content (70 kg adult):
- Na+: 3500-5000 mEq (~58 mEq/kg), 90% ECF, 10% ICF, 4% turnover.
- K+: 3000-3750 mEq (~53 mEq/kg), 98% ICF, 2% ECF, 2.3% turnover.
- Ca2+: 60,000 mEq, 0.01% turnover.
- Mg2+: 2000 mEq, 0.5% turnover.
- Phosphate: 18,000 mMol, 0.17% turnover.
Units of Measurement
Moles:
- 1 mole = molecular weight in grams, contains 6 × 10²³ molecules.
- Millimole (mmol) = 1/1000 mole, Micromole (µmol) = 1/1,000,000 mole.
- Example: 1 mol NaCl = 58.5 g (Na 23 g + Cl 35.5 g), 1 mmol = 58.5 mg.
Equivalents (Eq):
- 1 Eq = 1 mol / valence.
- Example: 1 mol NaCl = 1 Eq Na+ (23 g) + 1 Eq Cl- (35.5 g); 1 Eq Ca2+ = 40 g / 2 = 20 g.
Osmole:
- Measures osmotically active particles.
- 1 Osmole = Mol / Number of particles per molecule in solution.
Examples:
- 1 mol NaCl = 2 osmoles (1 Na+, 1 Cl-).
- 1 mol Na2SO4 = 3 osmoles (2 Na+, 1 SO4).
- 1 mol CaCl2 = 3 osmoles (1 Ca2+, 2 Cl-).
Formulas:
- mOsmol/L = [Weight (g/L) / Molecular weight (g)] × number of species × 1000.
- mEq = (mg × valence) / Molecular weight.
Example A: Convert 10 mg% Ca2+ to mEq/L and mOsmol/L.
- 10 mg% = 100 mg/L.
- mEq/L = (100 × 2) / 40 = 5 mEq/L.
- mOsmol/L = [0.1 / 40] × 1 × 1000 = 2.5 mOsmol/L.
Example B: mEq of 1.5 g KCl.
- Molecular weight KCl = 74.5.
- mEq = (1500 × 1) / 74.5 = 20 mEq/L.
Osmolality and Osmotic Pressure
Relation:
- At 37°C, 1 osmole/L = 19,300 mm Hg (25.4 atm).
- 1 mOsmol/L = 19.3 mm Hg.
- Body fluids (~300 mOsmol/L) = 5790 mm Hg osmotic pressure.
Tonicity:
- Osmolality of a solution relative to plasma osmolality.
- Examples: 0.9% NaCl (isotonic), 5% glucose (initially isotonic, later hypotonic).
Plasma Oncotic Pressure: 28 mm Hg (19 mm from proteins, 9 mm from Donnan effect).
Plasma Osmolality Calculation
Calculated Osmolality (CO):
- When Na, K in mEq/L or mmol/L, Glucose, BUN in mg/dL:
- Plasma Osmolality = 2(Na + K) + Glucose/18 + BUN/2.8
- Or: 2(Na) + Glucose/18 + BUN/2.8
- When all in mmol/L:
- Plasma Osmolality = 2(Na + K) + Glucose + BUN
- Or: 2(Na) + Glucose + BUN
Measured Osmolality (MO):
- Most accurate via freezing point depression.
Osmolal Gap:
- Difference between CO and MO.
- Indicates foreign substances (e.g., ethanol, methanol).
- Modified formula (with ethanol/mannitol):
- Plasma Osmolality = 2(Na) + Glucose/18 + BUN/2.8 + Ethanol/3.7 + Mannitol/18
Normal Osmolality: 280-290 mOsm/kg.
- Na+, Cl-, HCO3-: 270 mOsm.
- Glucose, urea: 20 mOsm.
- Plasma proteins (70 g/L): 2 mOsm.
Best Equation: Zander’s optimized equation (not commonly used).
Osmolal Gap: Normal within 10 mOsm/kg.
Intravenous Fluid Solutions
Fluid Summary:
Dextrose:
- 5%: Isotonic (physiologically hypotonic), 278 mOsm/kg, 50 g/L, 170 Cal/L.
- 10%: Hypertonic, 556 mOsm/kg, 100 g/L, 340 Cal/L.
Saline:
- 0.45%: Hypotonic, 154 mOsm/kg, 0 Cal.
- 0.9%: Isotonic, 308 mOsm/kg, 0 Cal, safe with blood products.
- 3%: Hypertonic, 1026 mOsm/kg, 0 Cal.
Dextrose in Saline:
- 5% in 0.225%: Isotonic, 355 mOsm/kg, 50 g/L, 170 Cal/L.
- 5% in 0.45%: Hypertonic, 432 mOsm/kg, 50 g/L, 170 Cal/L.
- 5% in 0.9%: Hypertonic, 586 mOsm/kg, 50 g/L, 170 Cal/L.
Multiple Electrolytes:
- Ringer’s: Isotonic, 309 mOsm/kg, 0 Cal, no sodium lactate.
- Lactated Ringer’s (Hartmann’s): Isotonic, 274 mOsm/kg, 0 Cal, similar to plasma, no Mg2+.
|
40 docs|9 tests
|
FAQs on Homeostasis of Body Fluids Chapter Notes - Physiology - NEET PG
| 1. What is homeostasis and why is it important for body fluids? |  |
| 2. How do control systems function in maintaining homeostasis? | |
| 3. What is the difference between feedforward control and feedback control in homeostasis? | |
| 4. How does body composition change with age and what are its implications for fluid balance? | |
| 5. What methods are used to measure body fluid levels and what is considered normal fluid balance? | |


Objective type Questions
,Sample Paper
,Summary
,study material
,Previous Year Questions with Solutions
,Semester Notes
,Important questions
,Extra Questions
,Exam
,Viva Questions
,video lectures
,Homeostasis of Body Fluids Chapter Notes | Physiology - NEET PG
,ppt
,Homeostasis of Body Fluids Chapter Notes | Physiology - NEET PG
,practice quizzes
,Free
,shortcuts and tricks
,MCQs
,past year papers
,mock tests for examination
,Homeostasis of Body Fluids Chapter Notes | Physiology - NEET PG
;


Chapter Notes: Homeostasis of Body Fluids Free PDF Download
Importance of Chapter Notes: Homeostasis of Body Fluids
Chapter Notes: Homeostasis of Body Fluids
Chapter Notes: Homeostasis of Body Fluids NEET PG Questions
Study Chapter Notes: Homeostasis of Body Fluids on the App
|
© EduRev
|
Education Revolution
|


|


