Introduction to Graphs Chapter Notes | Mathematics (Maths) Class 8 PDF Download

Introduction
- Graphs are visual tools that help us understand numbers easily. Instead of lots of numbers, we can use graphs to see trends and make comparisons.
- Graphs are commonly seen in newspapers, television, magazines, and books. They serve the purpose of presenting numerical facts in a visual format, making it easier and quicker for people to understand the information.
- Graphs are visual representations of data that has been collected. While data can also be presented in tables, graphs are often more effective, especially when showing trends or making comparisons.
- Graphs offer a clearer and more immediate understanding of data, particularly when there is a need to highlight changes over time or differences between groups.
Let's understand about Line graph in detail.
A Line Graph
When we need to see the changes continuously over a period of time then we use a line graph.
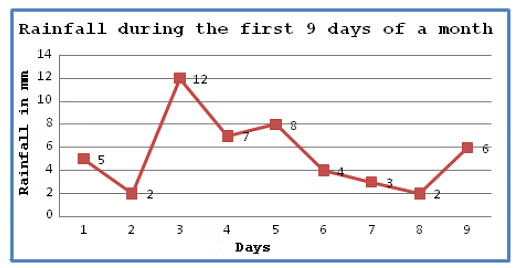
For example, in the above figure the horizontal line (x-axis) shows the number of days and vertical line (y-axis) shows the rainfall in mm on every successive day.
By this line graph, we can easily understand the changes in rainfall during these 9 days of a month.
Do you know?
A line graph which is a whole unbroken line is called a Linear Graph.
Coordinates of a Point
To write the coordinates of a point we need an x - coordinate and a y-coordinate of a point.
x-coordinate tells how many units to move right or left. It is also called the Abscissa.
y-coordinate tells how many units to move up or down. It is also called the Ordinate.
While writing the coordinates of a point in the coordinate plane, the x - coordinate comes first, and then the y - coordinate. We place the coordinates in brackets.
Coordinates of the point of intersection of x-axis and y-axis is (0, 0).this is called Origin.
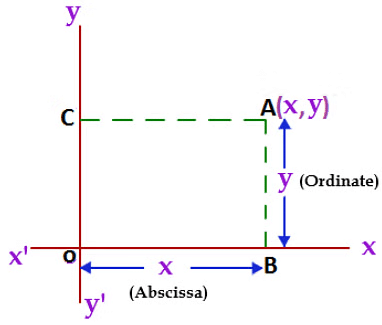
In the above figure, OB = CA = x coordinate (Abscissa), and CO = AB = y coordinate (Ordinate).
We write the coordinate as (x, y).
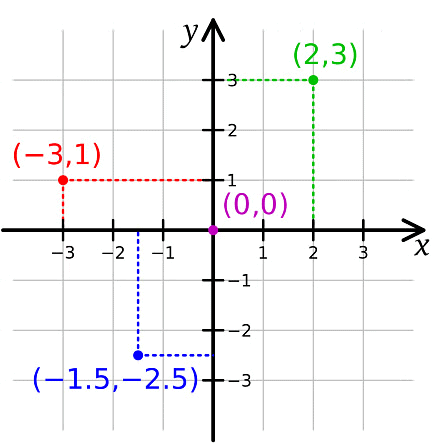
Example: Plot the given points on the graph sheet.
(2, 3)
(-3, 1)
(-1.5, – 2.5)
Solution:
Remark: If x ≠ y, then (x, y) ≠ (y, x), and (x, y) = (y, x), if x = y.
Some Applications
In our day-to-day life, there are so many situations where we can use the graph for comparisons and analysis.
1. Independent Variable
Anything which is completely independent and its movement do not depend on any other factor then it is called Independent Variable.
2. Dependent Variable
Anything which increases or decreases with the movement of any other factor or it is dependent on any other factor then it is called Dependent Variable.
The Relationship between the Independent and Dependent Variable
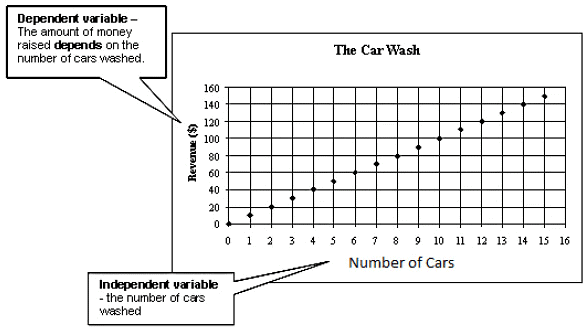
The above graph shows that the revenue will increase with the increase in the number of cars washed. So the revenue is the dependent variable and the number of cars washed is an independent variable.
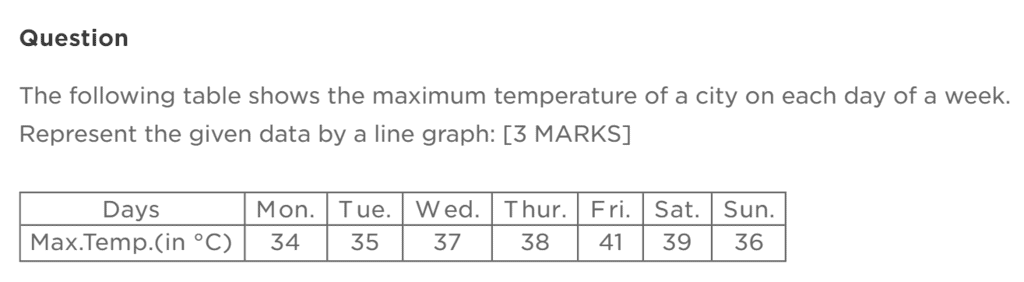
Solution:
Create a Graph:
- X-axis (Horizontal): Days of the week (Monday to Sunday)
- Y-axis (Vertical): Temperature in °C (ranging from 0°C to 35°C)
Plot the Points
Connect the Points:
- Draw a line connecting the plotted points.
Analysis:
- The highest temperature is on Sunday, reaching 41°C.
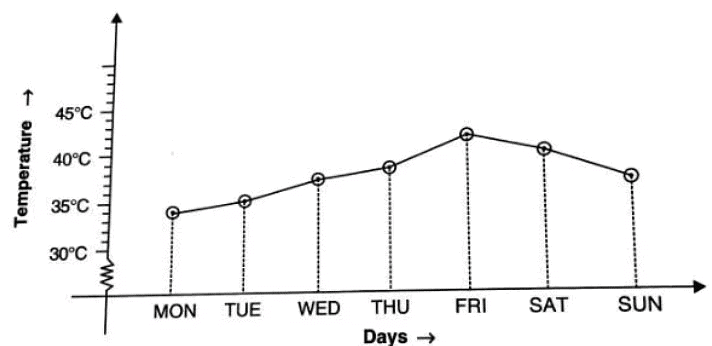
Example 2: The following line graph shows the yearly sales figure for a manufacturing company:
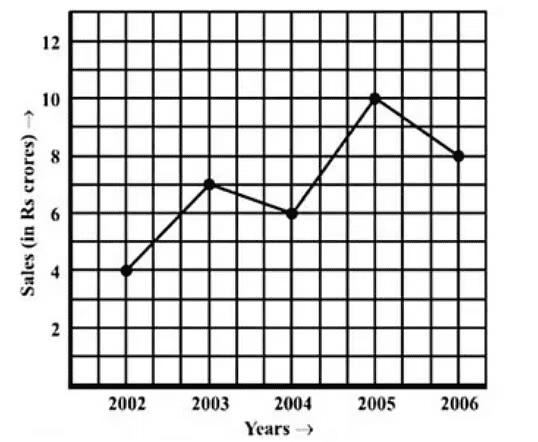 (a) What were the sales in (i) 2002 (ii) 2006?
(b) What were the sales in (i) 2003 (ii) 2005?
(c) Compute the difference between the sales in 2002 and 2006.
(d) In which year was there the greatest difference between the sales as compared to the previous year?
Sol: (a) (i) Sales in 2002 = Rs. 4 crore.
(ii) Sales in 2006 = Rs. 8 crore.
(b) (i) Sales in 2003 = Rs. 7 crore.
(ii) Sales in 2005 = Rs. 10 crore
(c) Hence, difference between the sales in 2002 and 2006 = Rs. (8 – 4) crore
(d) Difference between sales in 2006 and 2005 = Rs. (10 – 8) crore = Rs. 2 crore.
Difference between sales in 2005 and 2004 = Rs. (10 – 6) crore = Rs. 4 crore.
Difference between sales in 2004 and 2003 = Rs. (7 – 6) crore = Rs. 1 crore.
Difference between sales in 2003 and 2002 = Rs. (7 – 4) crore = Rs. 3 crore.
Therefore, the maximum sale was in the year 2005 compared to that of 2004.
|
81 videos|452 docs|31 tests
|
FAQs on Introduction to Graphs Chapter Notes - Mathematics (Maths) Class 8
| 1. What is a graph and why is it important in mathematics? |  |
| 2. What are the different types of graphs that students learn in Class 8? | |
| 3. How do you plot a point on a graph? | |
| 4. What are the advantages of using graphs to represent data? | |
| 5. How can you interpret the information presented in a graph? | |


Introduction to Graphs Chapter Notes | Mathematics (Maths) Class 8
,Summary
,shortcuts and tricks
,Sample Paper
,MCQs
,Previous Year Questions with Solutions
,ppt
,Semester Notes
,mock tests for examination
,video lectures
,Exam
,practice quizzes
,Viva Questions
,Important questions
,Introduction to Graphs Chapter Notes | Mathematics (Maths) Class 8
,Free
,study material
,Extra Questions
,past year papers
,Introduction to Graphs Chapter Notes | Mathematics (Maths) Class 8
,Objective type Questions
;


Chapter Notes: Introduction to Graphs Free PDF Download
Importance of Chapter Notes: Introduction to Graphs
Chapter Notes: Introduction to Graphs
Chapter Notes: Introduction to Graphs Class 8 Questions
Study Chapter Notes: Introduction to Graphs on the App
|
© EduRev
|
Education Revolution
|


|


within 7 days!