Sampling Chapter Notes | Quantitative Aptitude for CA Foundation PDF Download
Introduction
In many situations, we want to learn about a large and limitless group of things, like all the electrical lamps made by a company or all the people in a town. However, factors such as time, cost, and the sheer size of the group make it very hard to check every single item or person. Instead, we can look at a smaller, representative sample of the group and make guesses about the whole based on what we find in the sample.To understand this better, let's look at two examples:
Example 1: Mr. Basu and the Electrical Lamps
- Mr. Basu wants to order a large number of electrical lamps from Mr. Ahuja's company, "General Electricals." However, before placing the order, Mr. Basu needs to verify if Mr. Ahuja's claim that the lamps last for at least 1500 hours is true.
Example 2: Miss Manju Bedi and the Disease in Town
- Miss Manju Bedi, a social activist, has observed a rising incidence of a particular disease in her town. She believes that twenty percent of the people in her town are suffering from this disease.
Both of these situations present three common challenges:
1. Drawing a Representative Sample:
- In the first case, Mr. Basu needs to figure out how to select a group of lamps that accurately represents all the lamps produced by General Electricals.
- In the second case, Miss Bedi must determine how to choose a sample of people from her town that reflects the entire population.
2. Estimating Population Parameters:
- Mr. Basu wants to estimate the average lifespan of all the lamps based on the sample he tests.
- Miss Bedi aims to estimate the proportion of people suffering from the disease based on her sample.
3. Decision Making and Testing Claims:
- Mr. Basu needs to decide whether Mr. Ahuja's claim about the lamps is valid based on the sample results.
- Miss Bedi must determine if her claim about the disease prevalence is justified so that appropriate actions can be taken to address the health issue.
To make these decisions, we use something called "tests of significance" or "tests of hypothesis." These are tools that help us figure out if the evidence from the samples is strong enough to support the claims being made by Mr. Ahuja and Miss Bedi.
Basic Principles of Sample Survey
A sample survey is a method for studying an unknown population by using a representative sample taken from it. This raises the question: how can a small part of a larger group show the traits of the whole group? The answer lies in the basic principles of sample surveys, which include the following components:- Law of Statistical Regularity
- Principle of Inertia
- Principle of Optimization
- Principle of Validity
Law of Statistical Regularity:
- The law of statistical regularity states that if you randomly select a sample of a reasonable size from a population, the sample will, on average, share the characteristics of that population. Therefore, the sample should be moderately large. In fact, a larger sample size helps to better represent the population. The accuracy of a statistic in estimating a population's traits improves with the square root of the sample size. However, increasing the sample size isn't always feasible due to constraints like cost, time, and efficiency. Thus, we often find a balance between sample size and these factors.
- Additionally, it's crucial that the sample is drawn randomly from the population. This means every individual in the population should have a known chance of being included in the sample.
Principle of Inertia:
- The principle of inertia states that as the sample size increases, the results obtained from the sample become more reliable, accurate, and precise, assuming other conditions remain the same. This principle directly follows from the law of statistical regularity.
Principle of Optimization:
- The principle of optimization focuses on achieving the best level of efficiency at the lowest cost or the highest efficiency for a specific cost. This can be accomplished by choosing the right sampling design.
Principle of Validity:
- The principle of validity indicates that a sampling design is valid only if it can produce accurate estimates and tests regarding the population characteristics. Probability sampling is essential to ensure this validity.
Comparison Between Sample Survey and Complete Enumeration
- Complete Enumeration: Collecting information for all units in a population is known as a census.
- Preference for Sample Surveys: Sample surveys are often preferred over complete enumeration due to several factors:
- Speed: Sample surveys are quicker since only a portion of the population is surveyed.
- Cost: Although data collection per unit may be higher due to skilled personnel, the overall cost is generally lower with sample surveys.
- Reliability: Data from sample surveys can be more reliable due to trained enumerators and better supervision.
- Accuracy: While complete enumeration avoids sampling errors, both methods face non-sampling errors. Sample surveys can minimize sampling errors through larger sample sizes and proper design.
- Necessity: Sampling is essential in certain cases, such as destructive testing or hypothetical populations (e.g., coin tossing).
- Use of Complete Enumeration: Necessary for detailed information on all items, in small populations, or when single defects can cause significant issues (e.g., aircraft manufacturing).
Errors in Sample Survey
- Definition of Errors in Surveys: Deviation between the population parameter value from a sample and its observed value.
- Types of Errors:
- Sampling Errors
- Non-Sampling Errors
- Sampling Errors:Arise from only part of the population being investigated.
- Defective Sampling Design: Non-probabilistic design leads to bias.
- Substitution Errors: Replacing units for convenience creates bias.
- Faulty Demarcation: Incorrectly defined units can lead to under/overestimation.
- Wrong Choice of Statistic: Inappropriate statistic selection affects estimation.
- Population Variability: Variability among units can cause errors; complex designs may reduce this.
- Non-Sampling Errors:Occur in both sampling and complete enumeration.
- Causes include memory lapses, digit preferences, ignorance, psychological factors, non-responses, measurement errors, communication gaps, and incomplete coverage.
Some Important Terms Associated With Sampling
Population or Universe- The term "population" refers to the total collection of all units being considered. For instance, the entire output of lamps produced by "General Electricals" from past to future represents a population. Similarly, in the context of a town, all residents of Miss Manju's town form a population. The count of units within a population is termed population size. If there are 100,000 individuals in the town, this population size can be represented by N, which equals 100,000.
- Populations can be classified as finite or infinite. A finite population consists of a limited number of units, such as the population in Miss Manju's town. Conversely, an infinite population contains an unbounded or countless number of units. The population of lamps from General Electricals is considered infinite, as are the populations of stars, mosquitoes in Kolkata, flowers in Mumbai, and insects in Delhi.
- Populations can also be categorized as existent or hypothetical. An existent population includes tangible objects, such as the lamps from General Electricals or the residents of Miss Manju's town. In contrast, a hypothetical or imaginary population includes entities that are theorized, such as the potential outcomes of heads when a coin is tossed an infinite number of times.
Sample
- A sample is a subset of a population chosen to represent the entire group in terms of its characteristics. Selecting an appropriate representative sample is crucial, as statistical conclusions about the population are based on observations from this sample. The number of units in a sample is referred to as the sample size (n). For instance, if 500 electrical lamps are sampled from General Electricals' production, the sample size n equals 500. In this context, the sampling unit is the electrical lamp, while in another example involving humans, the sampling unit would be an individual person.
- A comprehensive list that includes all the sampling units is termed a "Sampling Frame." Prior to sampling, it is essential to have a complete and updated sampling frame to ensure accurate and representative samples are drawn.
Parameter
A parameter may be defined as a characteristic of a population based on all the units of the population. Statistical inferences are drawn about population parameters based on the sample observations drawn from that population. In the first example, we are interested about the parameter “Population Mean”. If x a denotes the a th member of the population, then population mean m, which represents the average length of life of all the lamps produced by General Electricals is given by Where N denotes the population size i.e. the total number of lamps produced by the company. In the second example, we are concerned about the population proportion P, representing the ratio of the people suffering from the disease to the total number of people in the town. Thus if there are X people possessing this attribute i.e. suffering from the disease, then we have
 Another important parameter namely the population variance, to be denoted by s2 is given by
 Also we have
Statistics
- A statistic can be understood as a measure that comes from a set of sample observations.
- It is a function of these sample observations, which means it depends on the values we collect.
- If we represent the sample observations as x1, x2, x3, ..., up to xn, we can express a statistic T in terms of these values.
- The relationship can be written mathematically as T = f(x1, x2, x3, ..., xn).
A statistic is used to estimate a particular population parameter. The estimates of population mean, variance and population proportion are given by
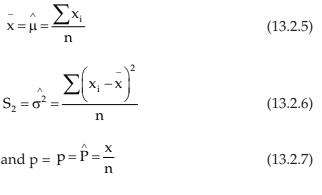
Where x, in the last case, denotes the number of units in the sample in possession of the attribute under discussion.
 |
Download the notes
Chapter Notes: Sampling
|
Download as PDF |
Sampling Distribution and Standard Error of a Statistic
- Starting with a population of N units, we can draw many a sample of a fixed size n. In case of sampling with replacement, the total number of samples that can be drawn is and when it comes to sampling without replacement of the sampling units, the total number of samples that can be drawn is Ncn.
- If we compute the value of a statistic, say mean, it is quite natural that the value of the sample mean may vary from sample to sample as the sampling units of one sample may be different from that of another sample. The variation in the values of a statistic is termed as “Sampling Fluctuations”.
- If it is possible to obtain the values of a statistic (T) from all the possible samples of a fixed sample size along with the corresponding probabilities, then we can arrange the values of the statistic, which is to be treated as a random variable, in the form of a probability distribution. Such a probability distribution is known as the sampling distribution of the statistic. The sampling distribution, just like a theoretical probability distribution possesses different characteristics. The mean of the statistic, as obtained from its sampling distribution, is known as “Expectation” and the standard deviation of the statistic T is known as the “Standard Error (SE)“ of T. SE can be regarded as a measure of precision achieved by sampling. SE is inversely proportional to the square root of sample size.
It can be shown that
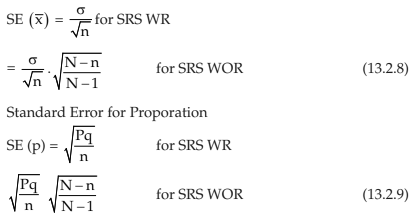
SRSWR and SRSWOR stand for simple random sampling with replacement and simple random sampling without replacement.
The factor  is known as finite population correction (fpc) or finite population multiplier and may be ignored as it tends to 1 if the sample size (n) is very large or the population under consideration is infinite when the parameters are unknown, they may be replaced by the corresponding statistic.
Illustrations
Example 13.2.1: A population comprises the following units: a, b, c, d, e. Draw all possible samples of size three without replacement.
Solution: Since in this case, sample size (n) = 3 and population size (N) = 5. the total number of possible samples without replacement = 5c3 = 10
These are abc, abd, abe, acd, ace, ade, bcd, bce,bde,cde.
Example 13.2.2: A population comprises 3 member 1, 5, 3. Draw all possible samples of size two
(i) with replacement
(ii) without replacement
Find the sampling distribution of sample mean in both cases.
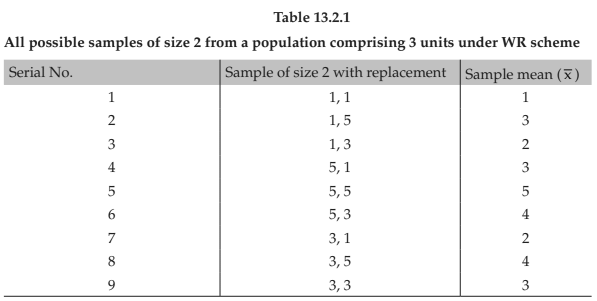
Solution: (i) With replacement :- Since n = 2 and N = 3, the total number of possible samples of size 2 with replacement = 32 = 9.
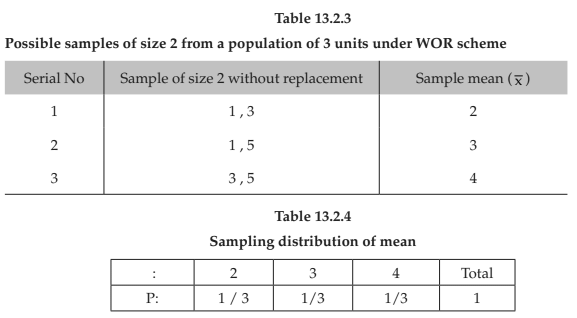
These are exhibited along with the corresponding sample mean in table 15.1. Table 15.2 shows the sampling distribution of sample mean i.e., the probability distribution of x bar .
(ii) without replacement: As N = 3 and n = 2, the total number of possible samples without replacement = NC2 = 3C2 = 3.
Example 13.2.3: Compute the standard deviation of sample mean for the last problem. Obtain the SE of sample mean applying 15.8 and show that they are equal.
Solution: We consider the following cases:
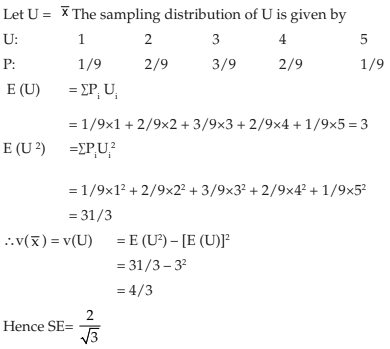
(i) with replacement :
Since the population comprises 3 units, namely 1, 5, and 3 we may take X1 = 1, X2 = 5, X3 = 3
The population mean (m) is given by
Thus comparing (1) and (2), we are able to verify the validity of the formula.
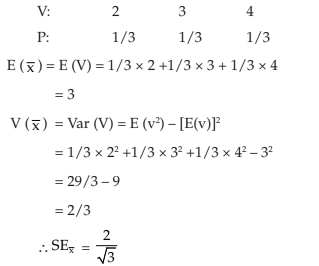
(ii) without replacement :
In this case, the sampling distribution of V = is given by
Applying 13.2.8, we have
and thereby, we make the same conclusion as in the previous case.
Types of Sampling
There are three main types of sampling:A. Probability Sampling
Probability sampling is a technique where every member of the population has a known and non-zero chance of being selected in the sample. This method is widely used in research to ensure that the sample is representative of the population. Here are some important types of probability sampling:
- Simple Random Sampling: In this method, every member of the population has an equal chance of being selected. This can be done using random number generators or lottery methods.
- Stratified Sampling: The population is divided into distinct subgroups or strata, and samples are taken from each strata. This ensures that all subgroups are represented in the sample.
- Multi-Stage Sampling: This involves multiple stages of sampling. For example, a researcher might first select a random sample of cities and then randomly select households within those cities.
- Multi-Phase Sampling: Similar to multi-stage sampling, but with additional phases. This is useful in large and complex populations.
- Cluster Sampling: The population is divided into clusters, and entire clusters are randomly selected. This is often used when the population is spread over a large area.
B. Non-Probability Sampling
Non-probability sampling is a method where not all members of the population have a chance of being included in the sample. This technique is often used when the researcher has specific criteria for selecting participants. Here are some key points about non-probability sampling:
- Judgment Sampling: The researcher uses their judgment to select participants who they believe will provide the most relevant information.
- Purposive Sampling: Similar to judgment sampling, but with a specific purpose in mind. For example, selecting experts in a particular field.
- Convenience Sampling: Participants are selected based on their availability and willingness to participate. This is the easiest form of sampling but may not be representative.
- Snowball Sampling: Existing participants recruit new participants from their acquaintances. This is useful in hard-to-reach populations.
C. Mixed Sampling
Mixed sampling is a combination of probability and non-probability sampling methods. This approach is used when researchers want to take advantage of both techniques to gather data. For example, a researcher might use probability sampling to select a sample and then use non-probability sampling to select additional participants with specific characteristics.
Simple Random Sampling (SRS)
- When units are chosen independently, where every unit in the population has an equal chance of being included in the sample, this method is called Simple Random Sampling or just Random Sampling.
- If units are selected one at a time and each selected unit is returned to the population before the next selection, maintaining the same population makeup, this is known as Simple Random Sampling with Replacement.
- Conversely, when units are selected one by one and are not returned to the population before the next selection, this is referred to as Sampling without Replacement.
- These two methods of sampling become nearly the same when the population is very large or infinite, or when a very large sample is drawn from the population.
- The most effective way to conduct Simple Random Sampling is by using random sampling numbers.
- Simple Random Samplingis a straightforward and effective method, especially if:
- The population size is not excessively large.
- The sample size is not too small.
- The population is not diverse, meaning there is little variability among its members.
- This method is completely free from Sampler’s Bias.
- All tests of significance are based on the principles of Simple Random Sampling.
Stratified Sampling
- Stratified sampling is utilized when the population is large and diverse. This method involves dividing the population into distinct strata or sub-populations, ensuring minimal variation within each stratum while maximizing variation between different strata. A stratified sample consists of sub-samples drawn from each stratum. Various sampling techniques can be applied to different strata. Specifically, when simple random sampling is utilized across all strata, it is referred to as stratified random sampling.
- The objectives of stratified sampling include: (i) ensuring representation from all sub-populations, (ii) providing parameter estimates for each stratum as well as an overall estimate, and (iii) reducing variability to enhance precision.
- There are two methods for allocating sample sizes: "Proportional allocation" (or "Bowley’s allocation") is used when there is minimal variation in strata variances, where sample sizes correspond to the population sizes of the strata. Conversely, "Neyman’s allocation" is employed when there is significant variance among strata, allowing sample sizes to vary in relation to both population size and standard deviation (ni µ NiSi), where ni is the sample size for the ith stratum, and Ni and Si are the population size and standard deviation, respectively. In Bowley’s allocation, the relationship is ni µ Ni.
- Stratified sampling is not recommended if: (i) the population is small, (ii) there is a lack of prior information, or (iii) there is little heterogeneity among the population units.
Multi Stage Sampling
- Multistage sampling involves a hierarchical structure where the population is divided into first-stage sampling units, each further subdivided into second-stage units, and so on, until reaching the ultimate sampling units. This method allows for sampling to occur in multiple stages.
- Initially, a selection of first-stage units is made. For each chosen first-stage unit, a number of second-stage units are then selected, continuing this process through to the ultimate sampling units. For example, to assess unemployment levels in India, one might consider states as first-stage units, districts as second-stage units, police stations as third-stage units, and households as the final sampling units.
- Multistage sampling offers extensive coverage, reduces computational effort, and is cost-effective. Additionally, it provides flexibility in the sampling process, which is often absent in other sampling designs. However, it may be less accurate than stratified sampling.
Systematic Sampling
- Systematic sampling is a method where sample units are selected at regular intervals after randomly choosing the first unit. This approach combines elements of probability and non-probability sampling; the first unit is selected using a probability method, while subsequent units are chosen according to a fixed, non-probabilistic rule.
- When the population size (N) is a multiple of the sample size (n), expressed as N = nk for a positive integer k less than n, the method involves randomly selecting one of the first k units and then choosing every kth unit until the sample frame is fully utilized. This is referred to as "linear systematic sampling," where k is known as the "sample interval."
- If N is not a multiple of n, it can be represented as N = nk + p (where p < k). In this case, the first unit is randomly selected from the range 1 to k, and every kth unit is then chosen in a cyclic order until reaching the desired sample size (n). This variation is known as "circular systematic sampling."
- Systematic sampling is advantageous when a complete and updated sampling frame is available, as it is generally quicker, cheaper, and simpler than other sampling methods. However, it has significant drawbacks. If there is an undetected periodicity in the sampling frame that coincides with the sampling interval, the resulting sample can be biased and unrepresentative of the overall population. Additionally, since systematic sampling includes non-probabilistic elements, it does not allow for statistical inferences about population parameters.
Purposive or Judgement sampling
- This sampling method relies entirely on the discretion of the sampler, who uses their own judgment influenced by personal beliefs, biases, preferences, and interests to select the sample.
- As a non-probabilistic approach, purposive sampling is inherently subjective and can differ significantly between individuals. Consequently, it does not allow for the testing of statistical hypotheses.
|
114 videos|169 docs|98 tests
|
FAQs on Sampling Chapter Notes - Quantitative Aptitude for CA Foundation
| 1. What are the basic principles of sample surveys? |  |
| 2. How does a sample survey differ from complete enumeration? |  |
| 3. What types of errors can occur in sample surveys? |  |
| 4. What is the significance of sampling distribution and standard error of a statistic? |  |
| 5. What are the main types of sampling methods used in surveys? |  |


