Characterisation of Inorganic Compounds by Nuclear Magnetic Resonance (NMR) Spectroscopy (Part - 2) - Government Jobs PDF Download

Integration
The area under each NMR absorption peak can be electronically integrated to determine the relative number of nuclei responsible for each peak. The integral of each peak can be provided numerically, and is often accompanied by a line that represents the integration graphically (see Figure 9 for an example). Intensities of signals can be compared within a particular NMR spectrum only. For example, 1H intensities cannot be compared to those of 19F or 31P nuclei. It is important to note that the integration of a peak is a relative number and does not give the absolute number of nuclei that cause the signal. Thus, the 1H NMR spectrum of H3C–SiH3 will show two peaks in a 1:1 ratio, as will the 1H NMR spectrum of (H3C)3C– Si(CH3)3. This is simply because the ratios 3:3 = 9:9 = 1:1. Nonetheless, the integrated intensities of the signals in an NMR spectrum are a vital piece of the puzzle.
The concept of integration, and also that of chemical shift, is illustrated by Figure 9. Determining integration ratios is an exercise in finding the greatest common divisor for the series of peaks (the largest whole number divisor that will produce a whole number ratio). In the above example, this value is either 1.4 cm or 9.9 integration units. It should be remembered that integration is a measurement that is subject to error; it is common for the error in integrated intensity to approach 5 - 10 %. The ratio of the integrated peak intensities is 1:3 = 3:9, allowing us to assign the resonance at δ 3.21 to the methyl group and that at δ 1.20 to the (CH3)3C group. It is important to note that the hydrogens of the (CH3)3C group are more shielded than the CH3 group. This occurs because the CH3 group is directly adjacent to the electron withdrawing oxygen, but the corresponding methyl protons in the (CH3)3C group are separated from oxygen by a second intervening carbon center.
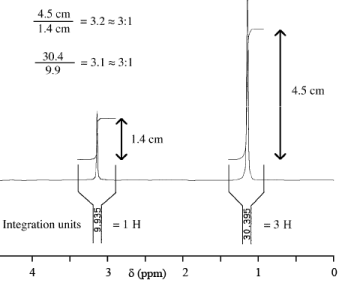
Figure 9. 1H NMR Spectrum of CH3OC(CH3)3.
At this stage, we can begin to appreciate how NMR resembles a molecular microscope. For example, at one frequency we could "see" the various protons, while the carbons, fluorines, phosphorus, and even certain metal nuclei could be observed at other frequencies. Within one spectrum, we can make use of the position (chemical shift) and integrated intensity of the different signals to assign particular molecular fragments responsible for them, and to build up a model of the molecule. There is one more aspect of NMR that is extremely helpful in determining how to connect the parts together.
Spin-Spin Splitting (Coupling)
The appearance of a resonance may be very different when there are other neighbouring magnetic nuclei. The reason for this is that the nucleus under observation will interact with the magnetic spins of the different neighbouring nuclei.
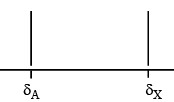
The simplest case is that of two protons having significantly different chemical shifts (designated A and X). Considering chemical shift and integration only, we could represent the spectrum as:
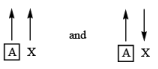
Both protons have a spin of 1/2, and both can exist in the +1/2 and -1/2 spin states. Now, it turns out that the magnetic environment of HA is slightly different when HX is in the +1/2 state than when it is in the -1/2 state. This can be represented pictorially with arrows (pointing either up or down) representing the two spin states of HX.
As a result, HA will split into two lines, each half the intensity of the unperturbed signal. Similarly, HA will influence HX which becomes a doublet also. The splitting, or coupling, is symmetrical about the unperturbed resonances δA and δX, and is described by the means of a coupling constant, JAX, which has units of Hz.
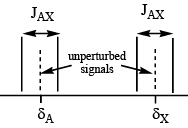
Note that the magnitude of JAX is identical at both signals - coupled nuclei must share the same coupling constant.
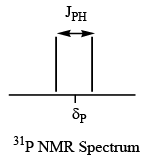
In a similar way, the resonance of a proton attached to phosphorus will be a doublet, since the phosphorus nucleus has I = 1/2 and may be in the +1/2 or -1/2 state. However, the key distinction here is that we are dealing with two different nuclei, and thus two different NMR spectra. Each NMR spectrum (1H and 31P) will show one doublet with a JPH coupling constant that is identical in magnitude. Recall that we cannot "see" a 31P nucleus in a 1H NMR spectrum and vice-versa. Nonetheless, the splitting of the peaks into doublets in each spectrum tells us that the 1H and 31P nuclei are interacting.
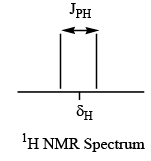
e.g., HPCl2
To review, the influence of the neighbouring spins is called spin-spin coupling and NMR peaks are split into multiplets as a result. The separation between the two peaks is called the coupling constant, J, which is expressed in Hz. Spin-spin coupling has the following characteristics:
- the magnitude of J measures how strongly the nuclear spins interact with each other.
- coupling is normally a through-bond interaction, and is proportional to the product of the gyromagnetic ratios of the coupled nuclei. For example, 1JCH = 124 Hz for 1H-13C coupling in CH4, and 1JSnH = 1931 Hz for 119Sn-H coupling in SnH4. This happens because γ(119Sn) is much larger than γ(13C).
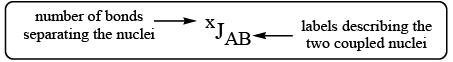
- since coupling occurs through chemical bonds, the magnitude of J normally falls off rapidly as the number of intervening bonds increases. e.g., 1JPH ~700; 2JPH ~20 Hz in Coupling constants are thus labeled to show the types of nuclei and the number of bonds separating the nuclei that give rise to spin-spin splitting.
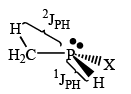
- since spin-spin coupling is a through-bond interaction, it is sensitive to the orientation of the bonds between two interacting nuclei. This is particularly important for two-bond coupling constants. The influence of the orientation of the two coupled nuclei can occasionally render 2J < 3J. For example,
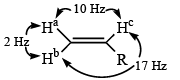
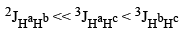
1J is not affected by the orientation of the coupled nuclei, so it is generally true that 1J >> 2J or 3J, but it is not always true that 2J > 3J.
- spin-spin interactions are independent of the strength of the applied field. The spacing (in Hz) between lines at two different field strengths will be the same if it is due to coupling, but will be proportional to the field strength if it is due to a difference in chemical shift.
Table 1.5. Typical Coupling Constant Ranges (in Hz).2,6
| Coupled Nuclei (AB in xJAB) | ||||
| x | HH | CH | PHb | PCb |
| 1 | - | 115 - 250 | 630 - 710 | 120 - 180 |
| 2a | 2 - 30 | 5 - 60 | 7 - 13 | 5 - 40 |
| 3 | 2 - 17 | 2 - 20 | 6 - 11 | 5 - 11 |
| 4 | - | - | 0 - 1 | - |
aTwo bond couplings are particularly sensitive to the geometrical arrangement of the nuclei, which in some cases may render 2JAB < 3JAB. bRestricted to acyclic compounds.
Cases involving more than two nuclei with I = 1/2 are direct extensions of the above. However, because there are more nuclear spins interacting, the pattern of lines observed in the NMR spectrum becomes more complicated. For example, let’s consider the 1H NMR spectrum of the HF2- anion (i.e., [F--H--F]-). We are observing the 1H nucleus, but it is coupled to two chemically equivalent 19F (I = 1/2) nuclei. There are four ways that we can arrange the nuclear spins of the two fluorine nuclei, but only three different energy states are created, as is explained below:
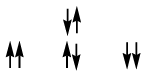
Extending what we learned about the generation of a doublet, we can clearly see that the 1H environment where both 19F spins are “up” is different from that where both 19F spins are “down”. However, we can also arrange things so that one 19F spin is “up” and the other is “down”. The latter case is degenerate; that is, there is more than one way of accomplishing an “up/down” arrangement of nuclei, but each “up/down” arrangement has the same energy. As a result, a pattern of three peaks (or triplet) with an intensity pattern of 1:2:1 is generated as shown above. It is important to note that each line in the triplet is separated by the same 1JHF coupling constant. As we would expect, the 19F NMR spectrum of HF2- would show a doublet because the fluorine nuclei are chemically equivalent and couple to one 1H nucleus.
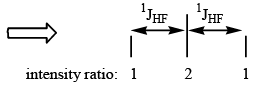
Another way of looking at this is to begin with a singlet for the 1H nucleus and then couple each 19F nucleus one step at a time. The coupling of the first 19F nucleus generates a doublet. When each line in this doublet is split again into a doublet, they overlap identically at the center of the signal, generating a single line of intensity two relative to each outer line of intensity one:
intensity ratio:
absence of coupling coupled to one I = 1/2 nucleus (doublet)
coupled to a second I = 1/2 nucleus with identical J
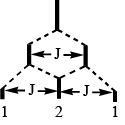
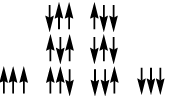
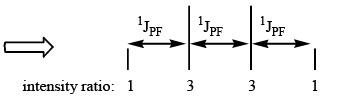
When a similar exercise is undertaken for the 31P NMR spectrum of PF3,* the nuclear spins of the three equivalent 19F nuclei can be arranged in four ways to generate a quartet
or we can split a singlet into doublets three times to accomplish the same transformation:
intensity ratio: absence of coupling coupled to one I = 1/2 nucleus (doublet)
coupled to a second I = 1/2 nucleus with identical J
coupled to a third I = 1/2 nucleus with identical J
In this case, when each line at the triplet stage is split again into doublets, the intensity of the overlapping peaks is not identical; a signal of relative intensity two (from the middle peak) overlaps with a signal of intensity one (from the outer peak) to create a peak of intensity three.
| * The 19F NMR spectrum of PF3 would be a doublet because the fluorine nuclei are chemically equivalent and couple to one 31P nucleus. |
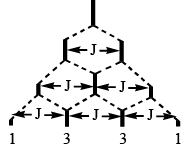
Fortunately, the pattern of peaks generated by the interaction of I = 1/2 nuclei can be easily generated by remembering that one nucleus is split by (n) equivalent nuclei into (n+1) peaks, each separated by the coupling constant, xJAB. The number of peaks is referred to as the multiplicity. The intensity pattern is a direct consequence of the number of combinations of the various nuclear spins that are possible and is described by a series of binomial coefficients. In practice, it is easiest to determine the intensity pattern by use of a mnemonic device such as Pascal's triangle.
| n | n+1 | Intensity | Multiplicity | Pattern | Example |
| 0 | 1 | 1 | singlet (s) | | | CH4 |
| 1 | 2 | 1 : 1 | doublet (d) | || | (CH3)2CHCl |
| 2 | 3 | 1 : 2 : 1 | triplet (t) |  |
CH3CH2Cl |
| 3 | 4 | 1 : 3 : 3 : 1 | quartet (q) |  |
CH3CH 2Cl |
| 4 | 5 | 1 : 4 : 6 : 4 : 1 | quintet |  |
29SiF4 |
| 5 | 6 | 1 : 5 : 10 : 10 : 5 : 1 | sextet |  |
PF5 |
| 6 | 7 | 1 : 6 : 15 : 20 : 15 : 6 : 1 | septet |  |
(CH3)2CHCl |
* An example of a case where the five fluorine nuclei are rendered equivalent by chemical exchange
The phenomenon of spin-spin coupling and its effect on the appearance and interpretation of NMR spectra is best described by example, several of which appear on the following pages.
Analyzing NMR Spectra and Reporting Results (WWW)
NMR spectra contain a wealth of information and must be analyzed in a methodical way. Much like a jig-saw puzzle, all of the pieces (i.e., chemical shift, integration, multiplicity, and coupling constants) must fit together properly. As with a puzzle, you may find that your initial conclusion is incorrect because several “pieces” are out of place. It is important to approach the problem in a creative way and investigate alternate solutions. The most straightforward method for analyzing NMR spectra is:
1) identify signals by chemical shift and determine their relative integration
2) identify the multiplicity of the peaks and calculate coupling constants.
Many students are tempted to “leap in” and attempt to analyze coupling patterns first, but the coupling pattern may not correlate if the integration ratio of the coupled multiplets has not already been deduced. Above all else, remember to double-check that the assignments make sense. It is often a good practice to use your results to generate a simple stick-diagram of the NMR spectrum . If the stick-diagram matches the actual spectrum exactly, then you have correctly analyzed the NMR spectrum.
Clear communication of the results of interpretation of NMR spectra is vital. Calculations and explanations of complex coupling patterns should be shown directly on the spectrum whenever possible. NMR spectra (generally provided as handouts by the T.A.) should be taped or stapled into your lab notebook to form part of your lab report.
The data extracted from NMR spectra should also be summarized in a table. The objective is for your summary to be brief, yet comprehensive enough so that the spectrum could be simulated from the information provided in the table. It is also important to briefly explain your assignments so that your reader understands how you arrived at your conclusion. In the case of complicated coupling patterns, an explanation to clearly show the source of each contributing coupling constant (such as sketch of a “coupling tree”) is usually appropriate.
Chemical shifts should generally be reported to two decimal places. Multiplicities may be written out (e.g., “triplet”) or expressed in terms of common abbreviations (e.g., “t”). Coupling constants are commonly reported as whole numbers, but may be expressed to one decimal place if the spectrum is of sufficiently high resolution. If peaks are picked in ppm, you should show how you calculated the coupling constant(s). The coupling constants should be properly labeled (i.e., xJAB) to show the nuclei that are coupled; if there is more than one NMR active isotope for a nucleus (e.g., 117Sn/119Sn), it should be clearly defined which is involved in the coupling interaction you are describing. Integration ratios are given in terms of whole numbers of nuclei, and you should demonstrate to your reader how you arrived at the ratio (i.e., did you measure the height of the integration line or were you relying on the integration unit values provided?).
For example, the data from the 1H NMR spectrum of B(OCH2CH2)3N would be summarized as:
| Chemical Shift δ(ppm) | Integration | Multiplicity | Coupling Constant J (Hz) | Assignment |
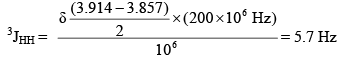
| 3.05 | 10.2 units = 2 H (or 88 mm = 2 H) | triplet (or t) | 3JHH = 5.7 Hz | NHC2 |
| 3.89 | 10.0 units = 2 H (or 86 mm = 2 H) | triplet (or t) | 3JHH = 5.7 Hz | OCH2 |
At least one sample calculation should be provided for full credit; e.g.,
FAQs on Characterisation of Inorganic Compounds by Nuclear Magnetic Resonance (NMR) Spectroscopy (Part - 2) - Government Jobs
| 1. What is nuclear magnetic resonance (NMR) spectroscopy and how is it used in the characterisation of inorganic compounds? |  |
| 2. How does NMR spectroscopy work in the characterisation of inorganic compounds? | |
| 3. What are the advantages of using NMR spectroscopy for characterising inorganic compounds? | |
| 4. What are the limitations of NMR spectroscopy in the characterisation of inorganic compounds? | |
| 5. Can NMR spectroscopy be used to determine the purity of inorganic compounds? | |


Characterisation of Inorganic Compounds by Nuclear Magnetic Resonance (NMR) Spectroscopy (Part - 2) - Government Jobs
,MCQs
,practice quizzes
,Free
,Sample Paper
,mock tests for examination
,Previous Year Questions with Solutions
,Important questions
,Semester Notes
,shortcuts and tricks
,past year papers
,Summary
,Viva Questions
,study material
,Characterisation of Inorganic Compounds by Nuclear Magnetic Resonance (NMR) Spectroscopy (Part - 2) - Government Jobs
,video lectures
,ppt
,Exam
,Objective type Questions
,Extra Questions
,Characterisation of Inorganic Compounds by Nuclear Magnetic Resonance (NMR) Spectroscopy (Part - 2) - Government Jobs
;


Characterisation of Inorganic Compounds by Nuclear Magnetic Resonance (NMR) Spectroscopy (Part - 2) Free PDF Download
Importance of Characterisation of Inorganic Compounds by Nuclear Magnetic Resonance (NMR) Spectroscopy (Part - 2)
Characterisation of Inorganic Compounds by Nuclear Magnetic Resonance (NMR) Spectroscopy (Part - 2) Notes
Characterisation of Inorganic Compounds by Nuclear Magnetic Resonance (NMR) Spectroscopy (Part - 2) Government Jobs Questions
Study Characterisation of Inorganic Compounds by Nuclear Magnetic Resonance (NMR) Spectroscopy (Part - 2) on the App
|
© EduRev
|
Education Revolution
|


|


