Class 10 Maths Chapter 13 Question Answers - Statistics

Q11. Find the mean, mode and median of the following data:
Class | Frequency |
0-10 | 3 |
10-20 | 4 |
20-30 | 7 |
30-40 | 15 |
40-50 | 10 |
50-60 | 7 |
60-70 | 4 |
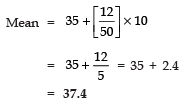
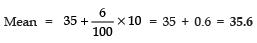
Sol. Let the assumed mean ‘a’ = 35
Here, h =10

| Classes | xi | fi | cf |  | fiui |
0-10 | 5 | 3 | 3 + 0 = 3 | -3 | (-3) x 3 = -9 |
10-20 | 15 | 4 | 4 + 3 = 7 | -2 | (-2) x 4 = -8 |
20-30 | 25 | 7 | 7 + 7 = 14 | -1 | (-1) x 7 = -7 |
30-40 | 35 | 15 | 15 + 14 = 29 | 0 | 0 x 15 = 0 |
40-50 | 45 | 10 | 10 + 29 = 39 | 1 | 1 x 10 = 10 |
50-60 | 55 | 7 | 7 + 39 = 46 | 2 | 2 x 7 = 14 |
60-70 | 65 | 4 | 4 + 46 = 50 | 3 | 3 x 4 = 12 |
Total |
| ∑fi = 50 |
|
| ∑uifi = 12 |
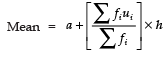
(i) 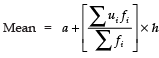
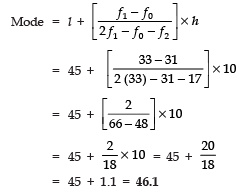
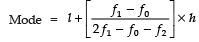
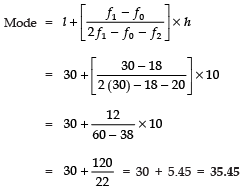
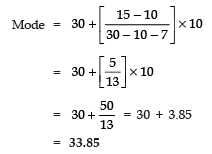
(ii) To find mode
Here, greatest frequency = 15
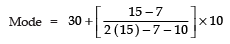
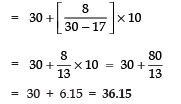
∴ Modal class = 30 − 40
l = 30, f1 = 15, f0 = 7, f2 = 10 and h = 10
So, 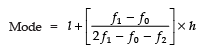
⇒ 
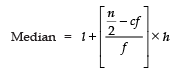
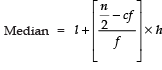
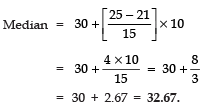
(iii) To find median
Here, 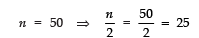
∴ Median class is 30−40.
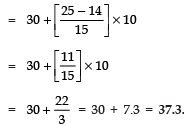
Such that l = 30, cf = 14, f = 15 and h = 10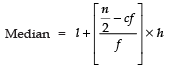
Q12. The following table gives daily income of 50 workers of a factory:
Daily income (in Rs) | 100-120 | 120-140 | 140-160 | 160-180 | 180-200 |
Number of workers | 12 | 14 | 8 | 6 | 10 |
Find the mean, mode and median of the above data.
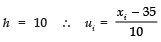
Sol. Let assumed mean a = 150. Here, h = 20
Daily income (in Rs) | No. of workers (fi) | xi |
| fi ui | cf |
100-120 | 12 | 110 | -2 | -24 | 12 + 0 = 12 |
120-140 | 14 | 130 | -1 | -14 | 12 + 14 = 26 |
140-160 | 8 | 150 | 0 | 0 | 26 + 8 = 34 |
160-180 | 6 | 170 | 1 | 6 | 34 + 6 = 40 |
180-200 | 10 | 190 | 2 | 20 | 40 + 10 = 50 |
Total | ∑ fi = 50 |
|
| ∑ fiui =-12 |
|

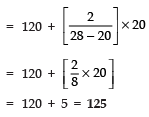
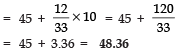
(i) Mean 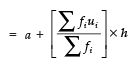
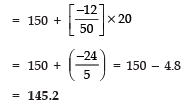
Thus, mean income is Rs 145.2
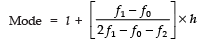
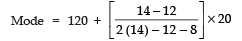
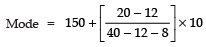
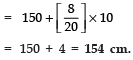
(ii) For finding the mode,
We have the greatest frequency = 14 which lies in the class 120−140
∴ Modal class = 120−140
Therefore, l = 120
f1 = 14
f0 = 12
f2 = 8
and h = 20
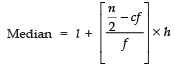
(iii) For finding median,
And 25 lies in the class 120−140
Median class is 120−140
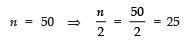
Since n/2 = 25, cf = 12, f = 14 and h = 20
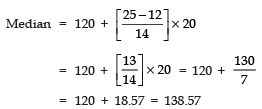
Median income = Rs138.57
Q13. Find the mode, median and mean for the following data:
Marks obtained | 25-35 | 35-45 | 45-55 | 55-65 | 65-75 | 75-85 |
Number of students | 7 | 31 | 33 | 17 | 11 | 1 |
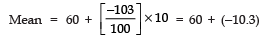
Sol. Let the assumed mean a = 60. Here h = 10, we have:
Marks obtained | Class marks xi | fi | cf |
| fi ui |
25-35 | 30 | 7 | 7 | -3 | -21 |
35-45 | 40 | 31 | 38 | -2 | -62 |
45-55 | 50 | 33 | 71 | -1 | -33 |
55-65 | 60 | 17 | 88 | 0 | 0 |
65-75 | 70 | 11 | 99 | 1 | 11 |
75-85 | 80 | 1 | 100 | 2 | 2 |
Total |
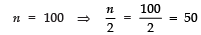
| ∑ f = 100 ⇒ n = 100 |
|
| ∑ fiui =-103 |

(i) 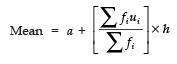
⇒ 
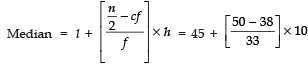
(ii) Median
Here, 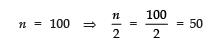
∴ Median class is 45−55.
l = 45
cf = 38
f = 33 and h = 10
(iii) Mode: Greatest frequency is 33 which corresponds to the class 45−55.
l = 45, h = 10
f1 = 33, f2 = 17
f0 = 31
Q14. A survey regarding the heights (in cm) of 50 girls of Class X of a school was conducted and the following data was obtained:
Height (in cm) | 120-130 | 130-140 | 140-150 | 150-160 | 160-170 | Total |
Number of girls | 2 | 8 | 12 | 20 | 8 | 50 |
Find the mean, median and mode of the above data.
Sol. We have:
Height (in cm) | f | cf | xi | fixi |
120-130 | 2 | 2 + 0 = 2 | 125 | 250 |
130-140 | 8 | 2 + 8 = 10 | 135 | 1080 |
140-150 | 12 | 10 + 12 = 22 | 145 | 1740 |
150-160 | 20 | 22 + 20 = 42 | 155 | 3100 |
160-170 | 8 | 42 + 8 = 50 | 165 | 1320 |
Total | 50 |
|
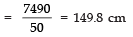
| 7490 |
(i) 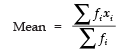
(ii) ∵ 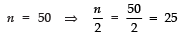
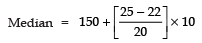
∴ Median class is 150−160.
∴ We have,
l = 150
f = 20
cf = 2
2h = 10
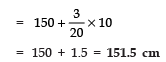
∴ 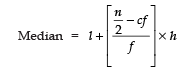
⇒ 
(iii) ∵ Greatest frequency = 20
∴ Modal class = 150−160
So, we have
l = 150, f0 = 12, f1 = 20
f2 = 8 and h = 10
Q15. Find the mean, mode and median of the following data:
Classes | Frequency |
0-10 | 5 |
10-20 | 10 |
20-30 | 18 |
30-40 | 30 |
40-50 | 20 |
50-60 | 12 |
60-70 | 5 |
Sol.
(i) Mean:
Let the assumed mean ‘a’ = 35
Now we have the following data:
| Class | Class mark xi | fi | Cf |  | fiui |
0-10 | 5 | 5 | 5 + 0 = 5 | -3 | (-3) x 5 = -15 |
10-20 | 15 | 10 | 5 + 10 = 15 | -2 | (-2) x 10 = -20 |
20-30 | 25 | 18 | 15 + 18 = 33 | -1 | (-1) x 18 = -18 |
30-40 | 35 | 30 | 33 + 30 = 63 | 0 | 0 x 30 = 0 |
40-50 | 45 | 20 | 63 + 20 = 93 | 1 | 1 x 20 = 20 |
50-60 | 55 | 12 | 83 + 12 = 95 | 2 | 2 x 12 = 24 |
60-70 | 65 | 5 | 95 + 5 = 100 | 3 | 3 x 5 = 15 |
Here ∑fi = 100 and ∑fiui = 6
(ii) Mode:
Here, the maximum frequency is 30.
∴ Modal class is 30−40.
So, we have
l = 30, h = 10
f1 = 30,
f0 = 18
f2 = 20
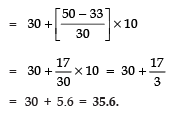
(iii) Median:
∴ Median class = 30−40
So, we have:
l = 30, h = 10, cf = 33, f = 30
Q16. Find the mean, mode and median for the following data:
Classes | Frequency |
0-10 | 3 |
10-20 | 8 |
20-30 | 10 |
30-40 | 15 |
40-50 | 7 |
50-60 | 4 |
60-70 | 3 |
Sol. Let the assumed mean = 35; h = 10
| Classes | xi | fi | cf |  | fiui |
0-10 | 5 | 3 | 3 + 0 = 3 | -3 | (-3) x 3 = -9 |
10-20 | 15 | 8 | 3 + 8 = 11 | -2 | (-2) x 8 = -16 |
20-30 | 25 | 10 | 11 + 10 = 21 | -1 | (-1) x 10 = -10 |
30-40 | 35 | 15 | 21 + 15 = 36 | 0 | 0 x 15 = 0 |
40-50 | 45 | 7 | 36 + 7 = 43 | 1 | 1 x 7= 7 |
50-60 | 55 | 4 | 43 + 4 = 47 | 2 | 2 x 4= 8 |
60-70 | 65 | 3 | 47 + 3 = 50 | 3 | 3 x 3= 9 |
Total |
| ∑fi = 50 |
|
| ∑fiui= -11 |
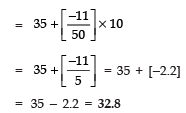
Now,
(i)
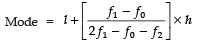
(ii) To find mode
Here, highest frequency is 15.
∴ Modal class is 30−40.
Here,
l = 30, f1 = 15, f0 = 10
f2 = 7 and h = 10
(iii) ∵ 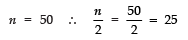
So, the median class is 30−40.
∴ We have l = 30, cf = 21, f = 15 and h = 10
We have
|
127 videos|584 docs|79 tests
|
FAQs on Class 10 Maths Chapter 13 Question Answers - Statistics
| 1. What is statistics and why is it important in the field of data analysis? |  |
| 2. What are the different types of data in statistics? | |
| 3. How is the mean calculated in statistics? | |
| 4. What is the difference between correlation and regression in statistics? | |
| 5. What is the significance of hypothesis testing in statistics? | |


Exam
,mock tests for examination
,ppt
,Sample Paper
,shortcuts and tricks
,Previous Year Questions with Solutions
,past year papers
,Viva Questions
,Summary
,Class 10 Maths Chapter 13 Question Answers - Statistics
,MCQs
,Free
,Class 10 Maths Chapter 13 Question Answers - Statistics
,video lectures
,study material
,Objective type Questions
,Class 10 Maths Chapter 13 Question Answers - Statistics
,practice quizzes
,Important questions
,Extra Questions
,Semester Notes
;


Long Answer Questions: Statistics - 2 Free PDF Download
Importance of Long Answer Questions: Statistics - 2
Long Answer Questions: Statistics - 2 Notes
Long Answer Questions: Statistics - 2 Class 10
Study Long Answer Questions: Statistics - 2 on the App
|
© EduRev
|
Education Revolution
|


|


