Class 10 Maths Chapter 13 Question Answers - Statistics
ADDITIONAL QUESTIONS SOLVED
VERY SHORT ANSWER TYPE QUESTIONS
Q1. In the following distribution: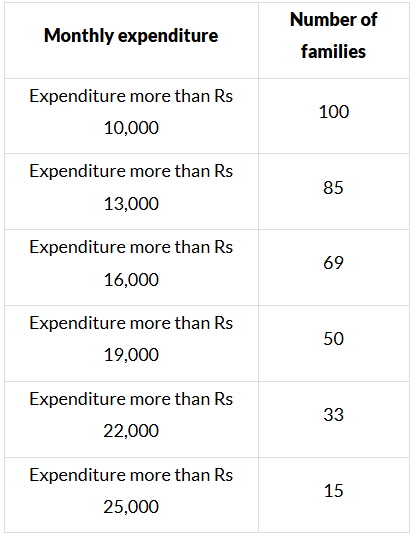
The number of families having expenditure range in (Rs) 16000–19000 is:
(i) 15
(ii) 16
(iii)17
(iv) 19
Sol. (iv)19 [∵ 69 − 50 = 19]
Q2. Construction of a cumulative frequency table is useful in determining the (i) mean (ii) mode (iii) median (iv) all the above
(i) mean
(ii) mode
(iii) median
(iv) all the above
Sol. (iii) median
Q3. The abscissa of the point of interaction of the ‘less than type’ and of the ‘more than type’ comutative frequency curve of grouped data gives its:
(i) mode
(ii) mean
(iii) median
(iv) All the three above
Sol. (iii) median.
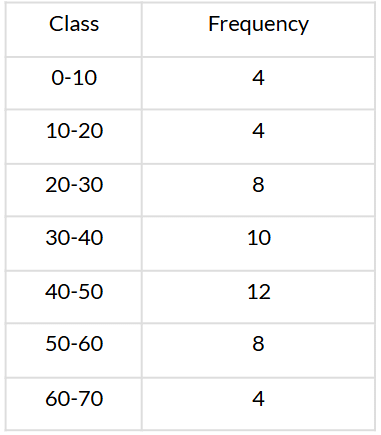
Q4. For the following distribution: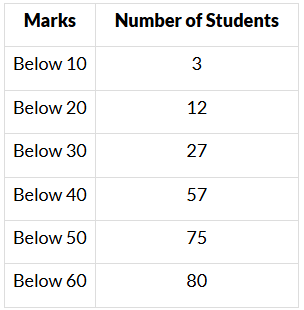
The modal class is
(i) 15−60
(ii) 30−40
(iii) 20−30
(iv) 10−20
Sol. (ii) 30−40
Q5. The formula ̄x = a + h [ Σ fi uiΣ fi] is used to determine:
(i) mean
(ii) mode
(iii) median
(iv) all the three above of grouped data.
Sol. (i) mean
Q6. Consider the following distribution: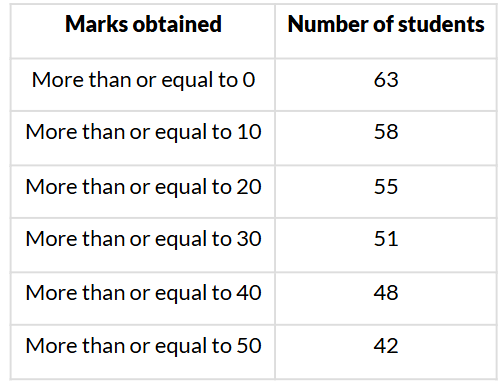 The frequency of the class 30−40 is:
(i) 51
(ii) 48
(iii) 4
(iv) 3
Sol. (iv) 3
Q7. Fill in the blank:
Mode = (..................) − 2 (Mean)
Sol. Mode = 3 (median) − 2 (Mean)
Q8. What is the modal class of the following frequency distribution?
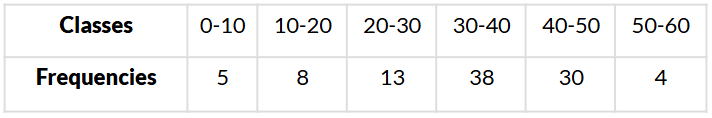 Sol. The Highest frequency 38 corresponds to 30−40.
∴ The modal class is 30–40.
Q9. Write the empirical relation between mean, mode and median.
Sol. The three measures i.e., mean, mode and median are connected by the following empirical relation:
Mode = 3 Median – 2 Mean
Q10. Write the median class of the following distribution:
Sol. We have: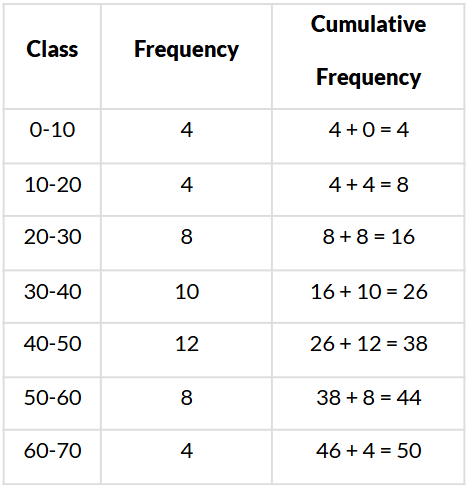
Here, n = 50 ⇒ n2 = 502 = 25
∵ 25 is cumulative frequency corresponding to the class 30−40.
∴ Median class is 30−40.
Q11. What is the modal class of the following frequency distribution?
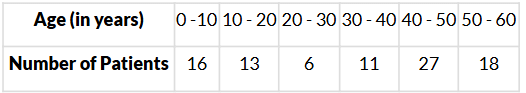
Sol. Here, the maximum class frequency is 27 and the class corresponding to this frequency is 40−50.
∴ The modal class is 40−50.
Q12. Find the median class of the following data:
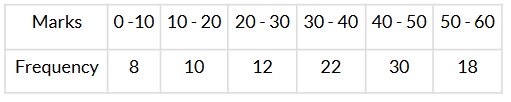
Sol. We have: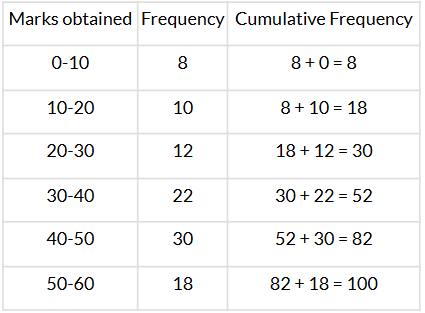
Here, n = 100 ⇒ n2 = 1002 = 50
∴ The median class is 30−40
Q13. Find the class marks of classes 10− 25 and 35− 55.
Sol. We have
Class mark of 10 - 25 = 10 + 252 = 352 = 17.5
Class mark of 35 - 55 = 35 + 552 = 902 = 45
|
126 videos|457 docs|75 tests
|
FAQs on Class 10 Maths Chapter 13 Question Answers - Statistics
| 1. What is the difference between mean, median, and mode in statistics? |  |
| 2. How do you calculate standard deviation? | |
| 3. What is a normal distribution? | |
| 4. What are the types of sampling methods in statistics? | |
| 5. What is the purpose of hypothesis testing in statistics? | |

|
1.9K Views |

|
4.75/5 Rating |

|
Dec 22, 2024 Last updated |

|
Explore Courses for Class 10 exam
|
|
past year papers
,Extra Questions
,Class 10 Maths Chapter 13 Question Answers - Statistics
,Class 10 Maths Chapter 13 Question Answers - Statistics
,ppt
,study material
,Free
,Summary
,mock tests for examination
,Viva Questions
,Semester Notes
,Exam
,Important questions
,practice quizzes
,Sample Paper
,video lectures
,Class 10 Maths Chapter 13 Question Answers - Statistics
,Previous Year Questions with Solutions
,shortcuts and tricks
,MCQs
,Objective type Questions
;


Very Short Answer Questions: Statistics Free PDF Download
Importance of Very Short Answer Questions: Statistics
Very Short Answer Questions: Statistics Notes
Very Short Answer Questions: Statistics Class 10
Study Very Short Answer Questions: Statistics on the App
|
© EduRev
|
Education Revolution
|


|


