Data Handling Class 6 Notes Maths Chapter 4
| Table of contents |
|
| Introduction |
|
| Recording Data |
|
| Organisation of Data |
|
| Pictograph |
|
| Interpretation of a Pictograph |
|

Introduction
Data handling is about organising and understanding information using different methods. You might have seen your teacher taking attendance of students in class each day or noting down the marks you received after tests or exams.
Similarly, a cricket scoreboard displays more than just the winner and loser of a match. It also provides vital information about the game, such as the time taken and the number of balls faced by the top run-scorer. In everyday life, tables like attendance records or exam scores arrange numbers to give valuable insights. These tables present data.
 View Answer

Recording Data
- Data Recording refers to the process of collecting and documenting information in an organized manner.
- Recording data is a basic step in managing information. It means keeping track of details in a clear way so you can easily find and use them later.
Example of Recording Data
Imagine a teacher wants to find out how many students prefer each mode of travel for a class trip. The options are bus, bike, car, and walk.
- Initial Method: The teacher lists each student's travel preference and counts how many selected each option, which can be slow with a large number of students.
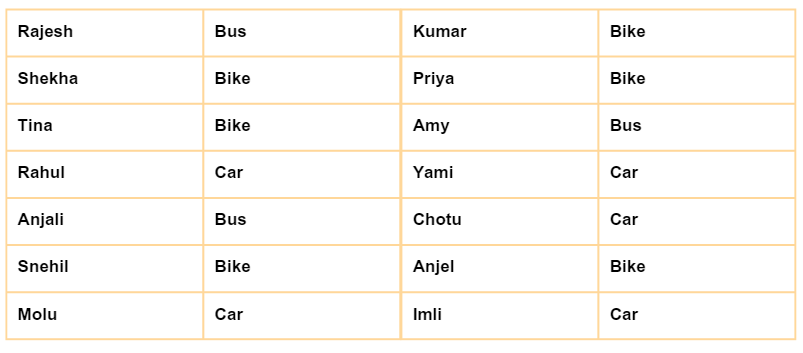
- Improved Method: The teacher sets up four boxes, each labelled with a mode of travel. Each student places a token (like a pebble) into the box for their chosen mode. At the end, the teacher counts the tokens in each box to see how many students prefer each mode of travel.
>> If we look at 5 students, they choose bus, bike, car, bus, bike.
>> They place pebbles in the corresponding boxes.
>> After all pebbles are placed, the teacher counts them:
Bus: 2 pebbles
Bike: 2 pebbles
Car: 1 pebble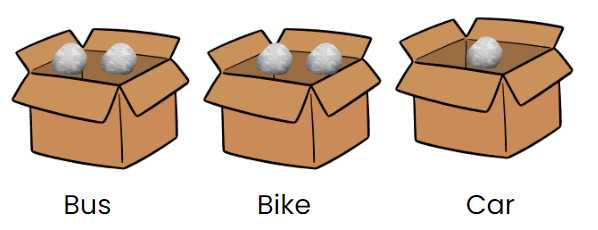 >> This method makes it quicker and easier to determine the preferred travel modes.
Organisation of Data
Organizing data means arranging information in a clear way to make it easy to count and understand.

- Recording Information: Instead of using pebbles, we can make a simple table where we marks a tick (✓) for each student’s choice. Each tick stands for one student.
- Counting Ticks: If two students choose bus, we put two ticks next to bus. Each tick represents one student’s choice.
- Finding the Total: To find out how many students there are, count all the ticks across all choices. For example, if there are 2 ticks for bus, 2 for bike, and 1 for car, then the total number of students is 2 + 2 + 1 = 5.
Organizing data helps make it easier to understand by putting it into a specific order. This can be done in alphabetic order and numerical order.
Tables
A table is a tool used to gather and arrange information by counting answers.
- Different options are listed in rows (like types of food).
- For each response, a | is added in the corresponding row.
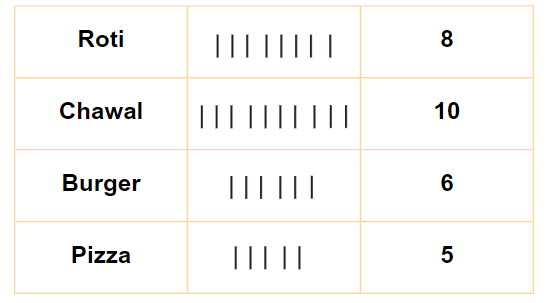
- The number of marks in each row shows how many people chose that option.
- This method helps easily see and count the number of responses for each choice.
- But counting single marks by hand can be exhausting and may lead to mistakes. Hence, we come up with Tally Marks.
Tally Marks
Tally marks are a simple way to count and organize data.
- Making Groups: Instead of counting each mark individually, group them in sets of five. Four vertical lines and a fifth diagonal line make a group of five (like this:
 ).
). Tally Marks representing 5-frequency
 - Counting: Each group of five helps you count more quickly. For example,
 means five, and two groups
 means ten.
 - Using in Tables: In a table, tally marks help keep track of how many people chose each option. For example, if you have tally marks for different shoe sizes, you can easily see which size is most or least popular.
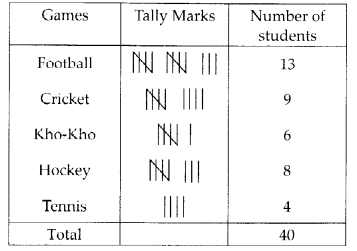
- For example, If you have tallies for games played by students, counting the marks quickly tells you how many students play which game.
Example: A survey was conducted among a few people regarding their favourite beverages. The below tally marks table shows the data: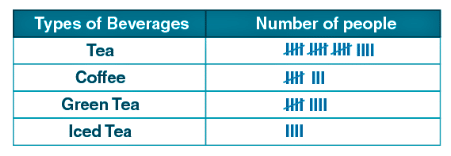
(i) How many more people like green tea than coffee?
(ii) How many people like tea?
(iii) How many total people were surveyed?
Ans:
(i) Number of people like green tea = 9
Number of people like coffee = 8
∴ One more people like green tea than coffee
(ii) Number of people who liked tea = 19
(iii) Total number of people surveyed = 40
Pictograph
- A pictograph represents data through pictures of objects.
- It helps answer the questions on the data at a glance.
- A pictograph represents data in the form of pictures, objects or parts of objects.

Example:
In the image provided, the picture drawn in front of each sport represents the number of students playing it. We can eaily count this.
Baseball is played by: 6 students (count the number of pictures drawn)
Soccer is played by: 8 students
Basketball is played by: 3 students
Interpretation of a Pictograph
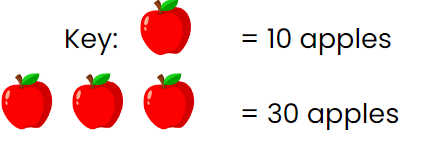
A pictograph uses pictures to show data, where each picture represents a set number of items. A key explains how many items one picture stands for, making it easier to represent larger quantities.
Example: If the key shows that one apple picture equals 10 apples, and you see 3 apple pictures in the pictograph, it means there are 30 apples in total.
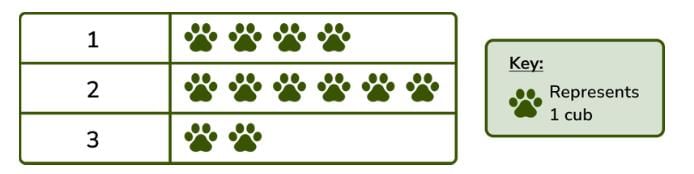
Which of the group has max number of cubs?
Q1:The number of cars parked in a parking lot every day is given in the pictograph.
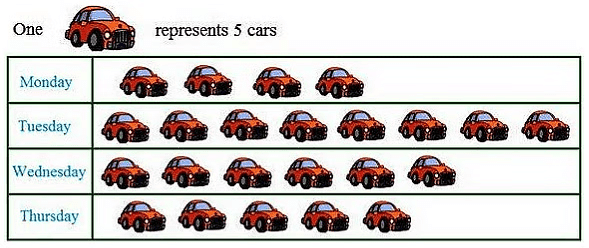
(i)Find the day when the highest number of cars are parked and how many?
(ii)When the least number of cars did park?
Ans:
(i) In the above pictograph one car represent 5 cars.
As there is the maximum number of cars is shown on Tuesday so the highest number of cars was parked on Tuesday.
Hence, 40 cars were parked on Tuesday in the parking lot.
(ii) Least number of cars were parked on Monday as there are only 4 pictures of cars are shown on that day.
Q2: The sale of electric bulbs on different days of a week is shown below:
Observe the pictograph and answer the following questions:
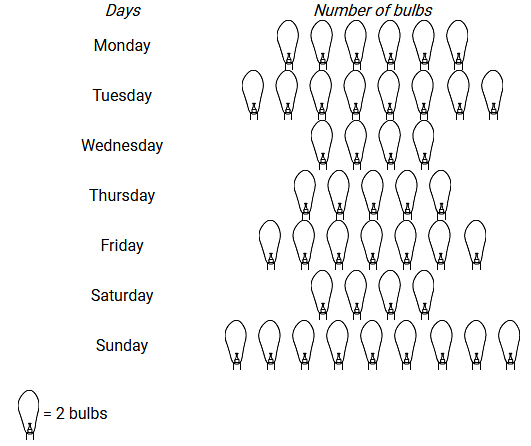
(i) How many bulbs were sold Friday?
(ii) On which day maximum numbers of bulbs were sold?
Ans:
(i) Number of figures of bulbs shown against Friday = 7
Given: 1 figure = 2 bulbs
Therefore, Total number of bulbs sold on Friday = 2 x 7 = 14
(ii) Sunday shows the maximum number of figure of bulbs, i.e. 9
Therefore, On Sunday, maximum bulbs were sold.
|
31 videos|121 docs|59 tests
|
FAQs on Data Handling Class 6 Notes Maths Chapter 4
| 1. What is data handling and why is it important in everyday life? |  |
| 2. How can data be recorded effectively? | |
| 3. What is a pictograph and how is it different from a bar graph? | |
| 4. How do you interpret data from a pictograph? | |
| 5. What are some common mistakes to avoid when creating a pictograph? | |


Data Handling Class 6 Notes Maths Chapter 4
,Exam
,Extra Questions
,video lectures
,Sample Paper
,ppt
,shortcuts and tricks
,Semester Notes
,Previous Year Questions with Solutions
,Objective type Questions
,Data Handling Class 6 Notes Maths Chapter 4
,study material
,Important questions
,Data Handling Class 6 Notes Maths Chapter 4
,Free
,practice quizzes
,Viva Questions
,MCQs
,Summary
,mock tests for examination
,past year papers
;


Chapter Notes: Data Handling Free PDF Download
Importance of Chapter Notes: Data Handling
Chapter Notes: Data Handling
Chapter Notes: Data Handling Class 6 Questions
Study Chapter Notes: Data Handling on the App
|
© EduRev
|
Education Revolution
|


|


within 7 days!