
Best Study Material for Class 6 Exam
Class 6 Exam > Class 6 Notes > Mathematics (Maths) Class 6 > Short Notes: Data Handling
Data Handling Class 6 Notes Maths Chapter 4
| Table of contents |
|
| Data |
|
| Recording Data |
|
| Organization of Data |
|
| Pictograph |
|
| Drawing a Pictograph |
|
| Bar Graph |
|
| Drawing a Bar Graph |
|
Data
Data is a collection of raw facts and figures that give you information.
Recording Data
- Recording of data depends upon the requirement of the data.
- Everybody has different ways to record data.
For Example: If we have to compare the choice of the people about certain movies then we have to collect the data of the survey which tells the choice of the people about those movies.
Organization of Data
- Data can be organized in a tabular form.
- Data is represented in a tabular form using frequency distribution and the tally marks.
- Frequency tells the number of times the particular observation happened.
- Tally marks are used to show the frequency of the data.
Tally marks are represented as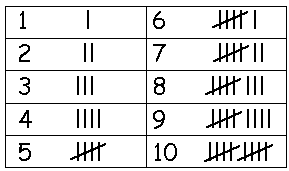
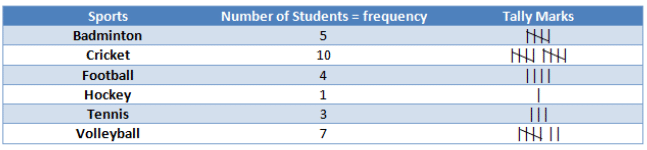
Example: There are 30 students in a class. They have to choose one sport each for the sports period.5 took badminton, 10 took cricket, 4 took football, 1 took hockey, 3 took tennis and 7 went for volleyball. Represent this data in the frequency distribution table.
Solution: To make a frequency distribution table-
- Make a table with three columns.
- Write the name of sports in the first column.
- Write the respective frequencies in front of each sport.
- Mark the tally marks according to the frequency given.
Question for Short Notes: Data Handling
Try yourself:What do tally marks do when we organize data?
View Solution
Pictograph
If we represent the data with the pictures of objects instead of numbers then it is called Pictograph. Pictures make it easy to understand the data and answer the questions related to it by just seeing it.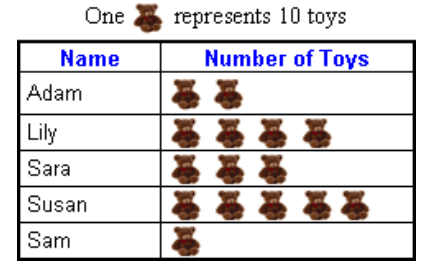
We can easily answer the questions like who has a maximum number of toys, who has the least number of toys etc.
Drawing a Pictograph
Drawing a pictograph is an interesting task but it may be difficult to draw some difficult pictures repeatedly as we had used cars in the above example so we can use easy symbols to draw a pictograph. We must use a proper key of the symbols so that it could be easily understood by anyone.
Example: The following table shows the choice of the fruits of the 35 students of class 3.represent the data in a pictograph.
| Name of Fruit | Number of Students |
| Mango | 5 |
| Apple | 12 |
| Guava | 3 |
| Litchi | 7 |
| Grapes | 8 |
Solution: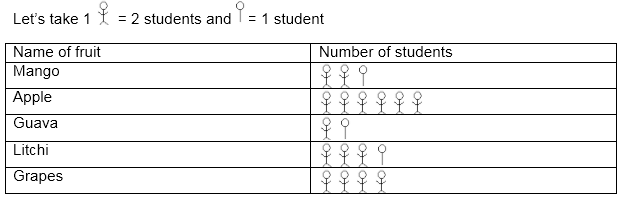
 |
Download the notes
Short Notes: Data Handling
|
Download as PDF |
Download as PDF
Bar Graph
As the pictograph is a very time-consuming process, so we can use another way to represent data. If we use the bars of the same width with equal spacing to represent the data in which the length of the bars represent the frequency is called Bar Graph or Bar Diagram.
Interpretation of a Bar Graph
Example: The following graph tells the favourite colours in a class of 30 students.
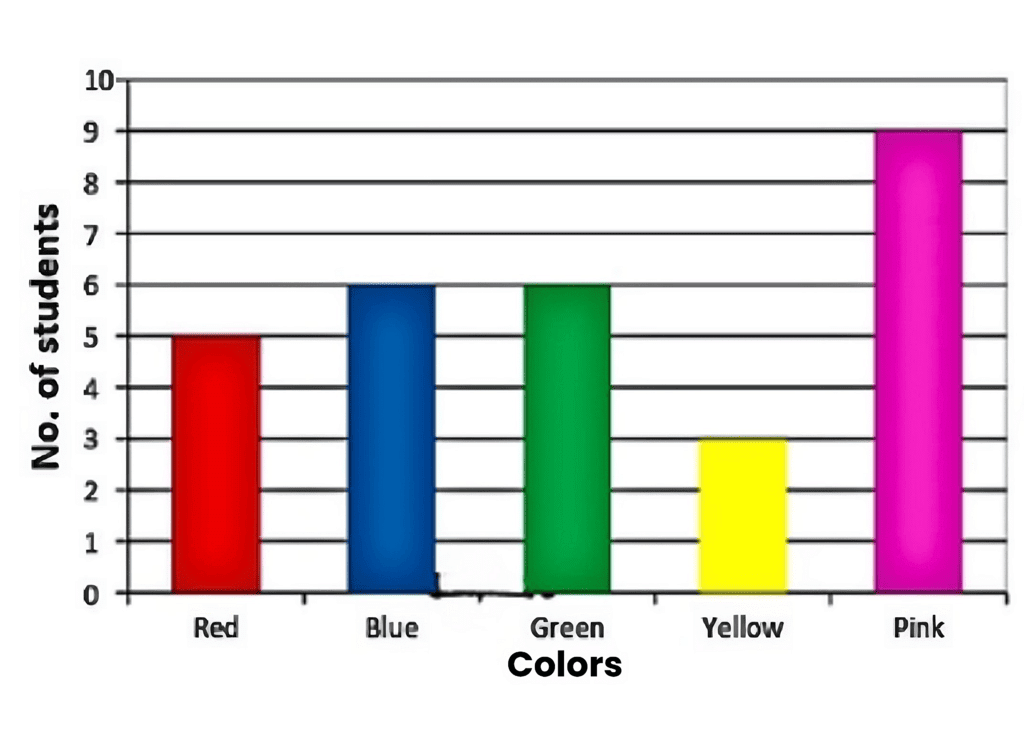
Answer the following questions:
- Which colour is liked by the maximum number of students?
- Which colour is liked by the same number of students?
Solution: The graph shows that the pink colour is liked by 9 students so it is the favourite colour of the maximum number of students. Blue and green colour bars are equal in length and both are liked by 6 students.
Question for Short Notes: Data Handling
Try yourself:What is a graphical representation where bars of the same width with equal spacing are used to represent data, with the length of the bars indicating the frequency?
View Solution
 |
Take a Practice Test
Test yourself on topics from Class 6 exam
|
Practice Now |
Practice Now
Drawing a Bar Graph
Drawing a bar graph is an interesting task, but we must choose an appropriate scale to draw the bar graph. It depends upon our own choice that what we are taking for the scale.
Example: The daily sale of mobile phones in Vicky production is given below. Draw the bar graph to represent the data.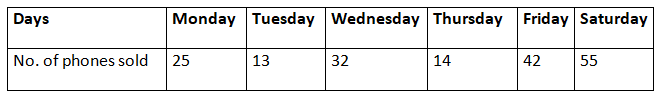
Solution: Steps to make a bar graph-
- Draw two lines, one horizontal and one vertical in L shape.
- Mark days on the horizontal line and no. of phones on the vertical line.
- Take a suitable scale for the number of phones and mark on the vertical line. Let 1 unit = 10 phones.
- Use the bars of equal width and draw them with the frequency given at the same distance.
The height of the bars tells the sale of the mobile phones in Vicky production.
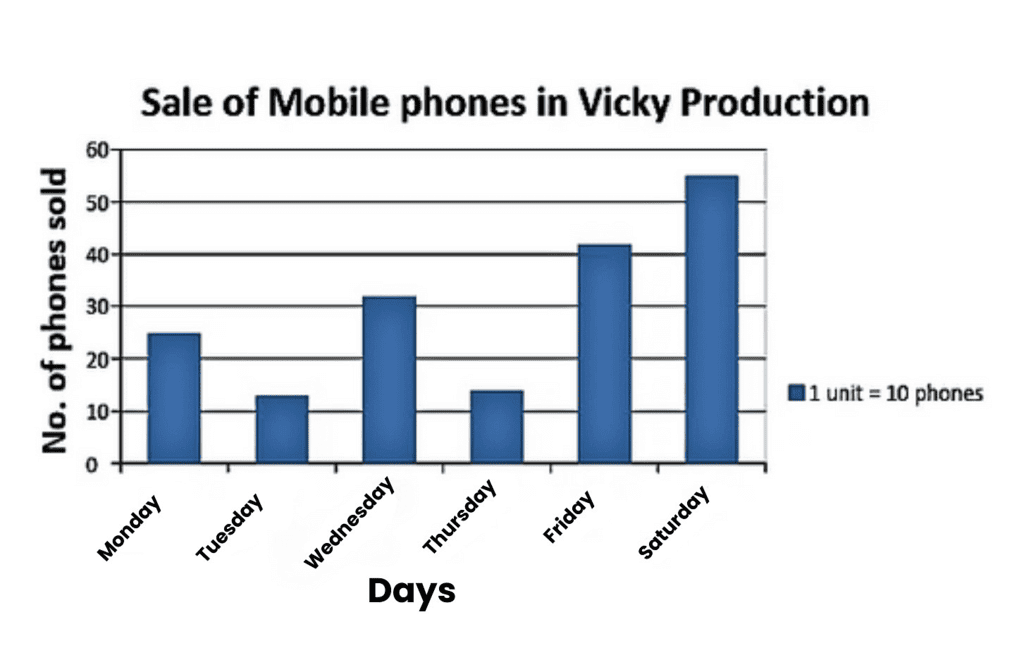
This same bar graph can be made by interchanging the positions of the days and the number of phones.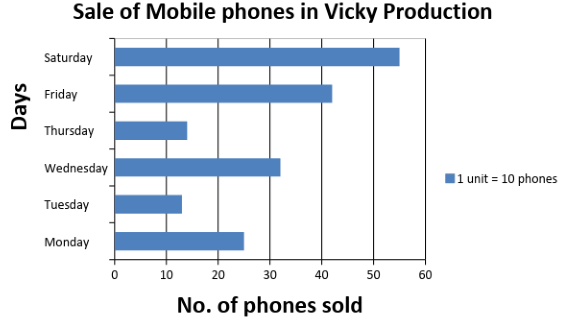
The document Data Handling Class 6 Notes Maths Chapter 4 is a part of the Class 6 Course Mathematics (Maths) Class 6.
All you need of Class 6 at this link: Class 6
|
92 videos|353 docs|54 tests
|


FAQs on Data Handling Class 6 Notes Maths Chapter 4
| 1. What is data recording and why is it important in data handling? |  |
| 2. How can data be organized effectively? | |
Ans.Data can be organized effectively by categorizing it into groups or classes, using tables or charts, and ensuring that it is arranged in a logical order. This makes it easier to analyze and interpret the information.
| 3. What is a pictograph and how is it different from other types of graphs? | |
Ans.A pictograph is a visual representation of data using pictures or symbols to represent values. It differs from other types of graphs, such as bar graphs, because it uses images instead of bars or lines, making it more visually appealing and easier for some audiences to understand.
| 4. How do you draw a pictograph? | |
Ans.To draw a pictograph, you start by choosing a symbol that represents a specific quantity. Then, you create a chart where each symbol corresponds to that quantity, ensuring you label the axes and include a key to explain what each symbol represents.
| 5. What are the steps to draw a bar graph? | |
Ans.To draw a bar graph, first, identify the data you want to represent. Next, label the axes appropriately, with one axis for categories and the other for values. Then, draw bars for each category, ensuring the heights correspond to the values, and finally, add a title and a legend if necessary.
About this Document

4.63/5
Rating

Mar 31, 2025
Last updated
Document Description: Short Notes: Data Handling for Class 6 2025 is part of Mathematics (Maths) Class 6 preparation.
The notes and questions for Short Notes: Data Handling have been prepared according to the Class 6 exam syllabus. Information about Short Notes: Data Handling covers topics
like Data, Recording Data, Organization of Data, Pictograph, Drawing a Pictograph, Bar Graph, Drawing a Bar Graph and Short Notes: Data Handling Example, for Class 6 2025 Exam. Find important definitions, questions, notes, meanings, examples, exercises and tests below for Short Notes: Data Handling.
Introduction of Short Notes: Data Handling in English is available as part of our Mathematics (Maths) Class 6
for Class 6 & Short Notes: Data Handling in Hindi for Mathematics (Maths) Class 6 course.
Download more important topics related with notes, lectures and mock test series for Class 6
Exam by signing up for free. Class 6: Data Handling Class 6 Notes Maths Chapter 4
Description
Full syllabus notes, lecture & questions for Data Handling Class 6 Notes Maths Chapter 4 - Class 6 | Plus excerises question with solution to help you revise complete syllabus for Mathematics (Maths) Class 6 | Best notes, free PDF download
Information about Short Notes: Data Handling
In this doc you can find the meaning of Short Notes: Data Handling defined & explained in the simplest way possible. Besides explaining types of
Short Notes: Data Handling theory, EduRev gives you an ample number of questions to practice Short Notes: Data Handling tests, examples and also practice Class 6
tests

Related Searches
Summary
,Sample Paper
,ppt
,study material
,Viva Questions
,Data Handling Class 6 Notes Maths Chapter 4
,Free
,Semester Notes
,past year papers
,Exam
,practice quizzes
,Previous Year Questions with Solutions
,mock tests for examination
,shortcuts and tricks
,video lectures
,Extra Questions
,Objective type Questions
,Data Handling Class 6 Notes Maths Chapter 4
,Important questions
,Data Handling Class 6 Notes Maths Chapter 4
,MCQs
;


Additional Information about Short Notes: Data Handling for Class 6 Preparation
Short Notes: Data Handling Free PDF Download
The Short Notes: Data Handling is an invaluable resource that delves deep into the core of the Class 6 exam.
These study notes are curated by experts and cover all the essential topics and concepts, making your preparation more efficient and effective.
With the help of these notes, you can grasp complex subjects quickly, revise important points easily,
and reinforce your understanding of key concepts. The study notes are presented in a concise and easy-to-understand manner,
allowing you to optimize your learning process. Whether you're looking for best-recommended books, sample papers, study material,
or toppers' notes, this PDF has got you covered. Download the Short Notes: Data Handling now and kickstart your journey towards success in the Class 6 exam.
Importance of Short Notes: Data Handling
The importance of Short Notes: Data Handling cannot be overstated, especially for Class 6 aspirants.
This document holds the key to success in the Class 6 exam.
It offers a detailed understanding of the concept, providing invaluable insights into the topic.
By knowing the concepts well in advance, students can plan their preparation effectively.
Utilize this indispensable guide for a well-rounded preparation and achieve your desired results.
Short Notes: Data Handling
Short Notes: Data Handling Notes offer in-depth insights into the specific topic to help you master it with ease.
This comprehensive document covers all aspects related to Short Notes: Data Handling.
It includes detailed information about the exam syllabus, recommended books, and study materials for a well-rounded preparation.
Practice papers and question papers enable you to assess your progress effectively.
Additionally, the paper analysis provides valuable tips for tackling the exam strategically.
Access to Toppers' notes gives you an edge in understanding complex concepts.
Whether you're a beginner or aiming for advanced proficiency, Short Notes: Data Handling Notes on EduRev are your ultimate resource for success.
Short Notes: Data Handling Class 6 Questions
The "Short Notes: Data Handling Class 6 Questions" guide is a valuable resource for all aspiring students preparing for the
Class 6 exam. It focuses on providing a wide range of practice questions to help students gauge
their understanding of the exam topics. These questions cover the entire syllabus, ensuring comprehensive preparation.
The guide includes previous years' question papers for students to familiarize themselves with the exam's format and difficulty level.
Additionally, it offers subject-specific question banks, allowing students to focus on weak areas and improve their performance.
Study Short Notes: Data Handling on the App
Students of Class 6 can study Short Notes: Data Handling alongwith tests & analysis from the EduRev app,
which will help them while preparing for their exam. Apart from the Short Notes: Data Handling,
students can also utilize the EduRev App for other study materials such as previous year question papers, syllabus, important questions, etc.
The EduRev App will make your learning easier as you can access it from anywhere you want.
The content of Short Notes: Data Handling is prepared as per the latest Class 6 syllabus.
|
© EduRev
|
Education Revolution
|


|


Signup on EduRev and stay on top of your study goals
10M+ students crushing their study goals daily