Ecosystems & Ecological Pyramids | Biology Class 12 - NEET PDF Download
| Table of contents |
|
| Ecosystems |
|
| Pyramids of Ecosystem |
|
| Productivity |
|
| Some Information |
|

Ecosystems
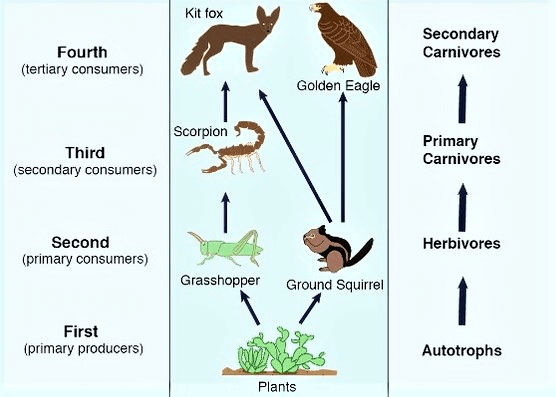
Food Web
- In a big ecosystem, many food chains are interlinked together on different trophic levels to form a food web.
- In the food web, the transfer of food energy is unidirectional but from many different alternative pathways.
- In the food web members of a particular tropic level obtain their food according to their choice and taste but that type of facility is not present in the food chain.
- It means they have more than one option or alternative for getting food.
As much as the food web is complex the ecosystem is more permanent or stable. Such a type of ecosystem is not destroyed naturally and continues for a long time. This ecosystem is not affected by the loss of any organism of any particular tropic level. Those ecosystems which have a simple food web are not very stable it means that they can be finished at any time if there is a change in any particular tropic level.
Homeostasis
- The ecosystem is a dynamic (functional) system because continuous interaction is going on in between abiotic or biotic components, so the ecosystem is present in an equilibrium position.
- The ecosystem is also self maintainable and self-regulatory system, which means an ecosystem maintains a balance between different tropic levels.
- Each tropic level controls the other tropic level in an ecosystem.
- If any change takes place in any tropic level of the ecosystem, the other tropic levels of this ecosystem may react according to it.
- So ecosystem always remains in equilibrium. This feature of the system is known as homeostasis.
Cybernetics
The science of self-control as (homeostasis) in an ecosystem is called cybernetics.
Pyramids of Ecosystem
- Graphical representation of ecological parameters at different tropic levels in the ecosystem is called pyramids.
- These parameters are Number, Biomass and Energy. First of all, the pyramid was formed by Charles Elton; So we called it the Eltonian pyramids.
- In pyramids basal, mid and top tiers show the parameter values for producer, herbivores and carnivores in the ecosystem.
Pyramids are of Three Types:
- Pyramids of Number
- Pyramids of Biomass
- Pyramids of Energy
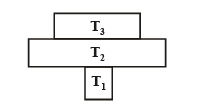
1. Pyramids of Number
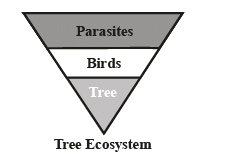
In this type of pyramid, the number of the individual organisms in various tropic levels is shown. These pyramids are mostly upright because the number of producers [T1] is maximum and No. of herbivores and carnivores decrease towards the apex or at successive tropic levels, such as Grassland ecosystem and aquatic ecosystem. 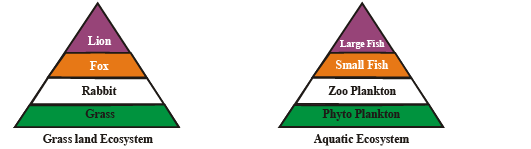 But in a tree ecosystem, the pyramid of numbers is inverted. This is called a parasitic ecosystem because birds (herbivores) depend on the tree (producer) and parasites (consumer) depend on birds, therefore with an increase in the number of tropic levels, the number of the organisms increases sequentially.
Note:
Maximum number of producers are present in aquatic ecosystem. The number of organisms at any tropic level depends upon the availability of organism which are used as food on lower level so availability of food is the main factor.
Pyramid of number shows biotic potential of a ecosystem. The number of members of any particular species in favourable conditions is called their biotic potential. When the number of the members of any species increases then it is called population explosion. Because of this, existence of the species comes in danger. Human population is also near this condition at present.
2. Pyramids of Biomass
Pyramids of biomass represent the total amount of biomass of each tropic level of the ecosystem, mostly these pyramids are also upright (erect) e.g. (tree ecosystem), forest ecosystem.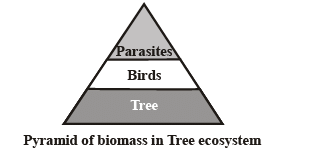 Pyramids of biomass in an aquatic ecosystem are inverted because in it producers are micro-organisms and their biomass is very less.
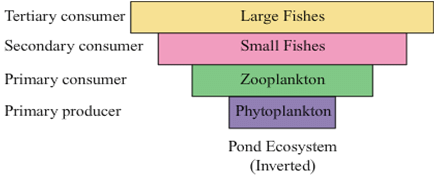
Note: Pyramid of lake on the basis of biomass:
Limitations of Ecological Pyramids
- It does not take into account the same species belonging to two or more trophic levels.
- It does not accommodate a food web.
- Saprophytes are not given any place.
Some Special Points related to Biomass
- Standing crop – Total amount of living organic matter present in a particular area in particular time in an ecosystem is known as standing crop. It may be expressed in terms of weight per unit area.
- Biomass is the standing crop expressed in terms of weight (i.e. organism mass). Biomass is measured by a bomb calorimeter.
- Standing quality or Standing state – Total amount of inorganic substances such as P, S, N, H present in a particular area at a particular time in an ecosystem is known as standing state.
Note: The pyramids of biomass show the standing crop of ecosystem.
3. Pyramids of Energy
It represents amount of energy at different tropic levels, energy pyramids are always upright or erect because there is a gradual decrease in energy at successive tropic levels. According to the 10% law of Lindemann, the 90% part of obtained energy of each organism is utilized in their various metabolic activities and heat and only 10% energy is transferred to the next tropic level. So 90% energy is lost at each tropic level, therefore top consumers like lion etc. are ecologically weakest but physically they are strong.
Note: Pyramids of energy represent the productivity of ecosystem as well as transfer of production in ecosystem.
Some Information: The respiration cost also increases along successive higher tropic levels normally on an average respiration of producers consume about 20% of its gross productivity. Herbivores consume about 30% and 60% consumed by carnivores in respiration.
Productivity
There are two types of productivity present:
1. Primary productivity
Primary production is defined as the amount of biomass or organic matter produced per unit area over a time period by plants during photosynthesis. It is expressed in terms of weight (g/m2/yr) or energy (Kcal m–2). The rate of biomass production is called productivity. It is expressed in terms of g–2yr–1 or (Kcal m–2) yr–1 to compare the productivity of the different ecosystems. It can be divided into GPP and NPP.
It is again divided into two types:
- Gross primary productivity (G.P.P.) – It is the total amount of energy fixed (organic food) in an ecosystem (in producers) in unit time is called G.P.P. including the organic matter used up in respiration during the measurement period. It is also known as total (Gross) photosynthesis. A considerable amount of GPP is utilised by plants in respiration.
- Net primary productivity (N.P.P.) – It is the amount of stored organic matter in plant tissues after respiratory utilisation.
NPP = GPP – R (R = Respiration + Metabolic activities)
or GPP = NPP + R
NPP is the available biomass for the consumption of heterotrophs.
2. Secondary productivity
Secondary productivity is the rate of formation of new organic matter by consumers.
Net community productivity or Net productivity – The rate of storage of organic matter not used by the heterotrophs.
NCP = N.P.P. – HR (HR = Energy used by Heterotrophs or consumers)
Some Information related to Productivity
- Primary productivity depends on the plant species inhabiting a particular area. It also depends on a variety of environmental factors, like the availability of nutrients and the photosynthetic capacity of plants.
Therefore it varies in different types of ecosystems. The annual net primary productivity of the whole biosphere is approximately 170 billion tons (dry weight) of organic matter, productivity of the ocean are only 55 billion tons. - In per unit area, maximum productivity is found in the tropical rain forest.
- In water, the least productive ecosystem is very deep lakes and the highly productive ecosystem is a coral reef.
- Nitrogen is the limiting factor in the ocean and phosphorus is the limiting factor in lake productivity.
- Inland – Tropical rain forest i.e. 5 kg/m2/year.
- The lowest productivity is of Deserts, tundra.
- The most productive Agro-ecosystem is the Sugar cane and rice ecosystem –> 3-4 kg./m2/year.
Some Information
- Ecological efficiency: The percentage of energy transferred from one tropic level to the next is called ecological efficiency or food chain efficiency.
E. E =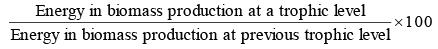
- Assimilation efficiency: It is the proportion of consumed energy that is assimilated.
A. E.=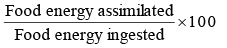
- Net production efficiency :
N.P.E. =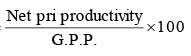
- Photosynthetic efficiency :
P.E. =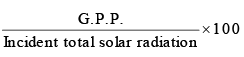
|
59 videos|290 docs|168 tests
|
FAQs on Ecosystems & Ecological Pyramids - Biology Class 12 - NEET
| 1. What is an ecosystem? |  |
| 2. What are ecological pyramids? | |
| 3. How are ecological pyramids useful in understanding ecosystems? | |
| 4. What is productivity in an ecosystem? | |
| 5. How can the concept of productivity be applied to real-world scenarios? | |


Sample Paper
,Ecosystems & Ecological Pyramids | Biology Class 12 - NEET
,ppt
,Exam
,Semester Notes
,mock tests for examination
,shortcuts and tricks
,practice quizzes
,past year papers
,Objective type Questions
,Important questions
,Extra Questions
,Viva Questions
,Ecosystems & Ecological Pyramids | Biology Class 12 - NEET
,MCQs
,study material
,Previous Year Questions with Solutions
,video lectures
,Ecosystems & Ecological Pyramids | Biology Class 12 - NEET
,Summary
,Free
;


Ecosystems & Ecological Pyramids Free PDF Download
Importance of Ecosystems & Ecological Pyramids
Ecosystems & Ecological Pyramids Notes
Ecosystems & Ecological Pyramids NEET Questions
Study Ecosystems & Ecological Pyramids on the App
|
© EduRev
|
Education Revolution
|


|


