Graphs: Motion in One Dimension | AP Physics 1 - Grade 9 PDF Download
| Table of contents |
|
| Analysis of Motion through Graphs |
|
| Displacement–Time Graph |
|
| Velocity–Time Graph |
|
| Acceleration–Time Graph |
|

Analysis of Motion through Graphs
Let us see some basics points of graphs before analyzing the motion of an object through graphs.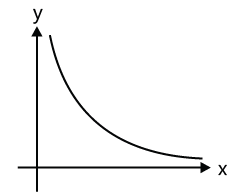 Basic Graphs: (a) A linear relationship between x and y represents a straight line.
E.g., y= 4x - 2, y= 5x + 3, 3x = y - 2
(b) A proportionality relationship between x and y (i.e. x ∝ y or y = kx ) represents a straight line passing through origin.
(c) Inverse proportionality (x ∝ 1/y) or xy=k represents a rectangular hyperbola.
Shape of a rectangular hyperbola is given in the graph:
(d) A quadratic equation in x and y represents a parabola in x-y graph. E.g., y = 3x2 +2, y2 = 4x, x2 = y-2
Analysis of Graphs: (a) If z dy/dx, the value of z at any point on x-y graph can be obtained by the slope of the graph at that point.
(b) If z = y(dx) or x(dy), the value of z between x1 and x2 or y1 and y2 is obtained by the area of graph between x1 and x2 or y1 and y2.
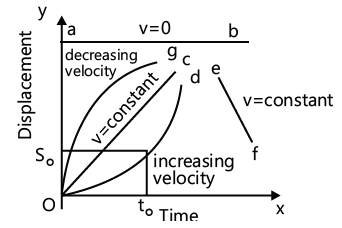
Displacement–Time Graph
With displacement of a body plotted on y-axis against time on x-axis, displacement–time curve is obtained.
(a) The slope of the tangent at any point of time gives the instantaneous velocity at any given instant.
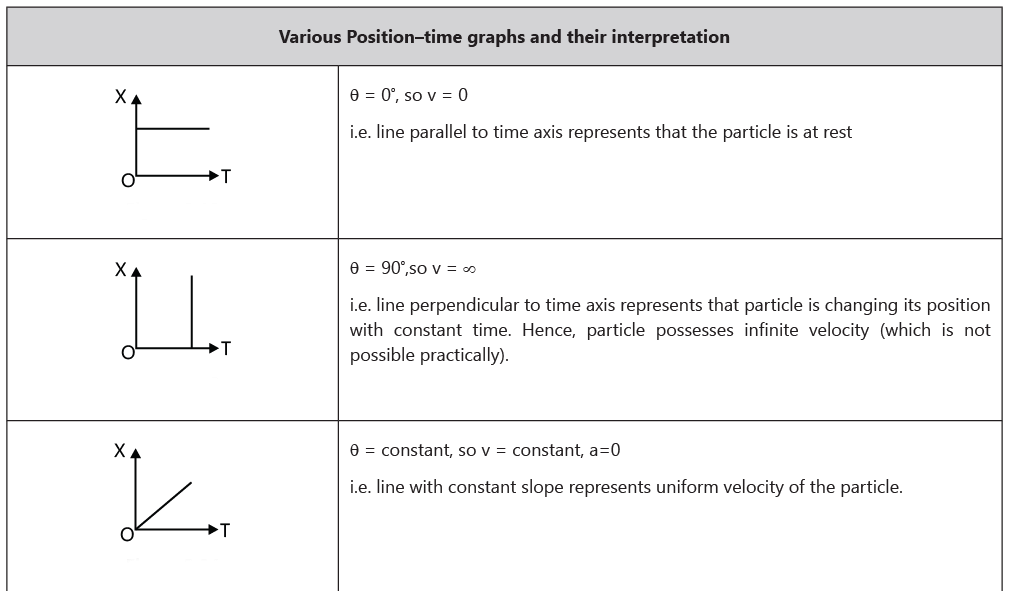
(b) At a uniform motion the displacement–time graph is a straight line.
- If the graph obtained is parallel to time axis, the velocity is zero.
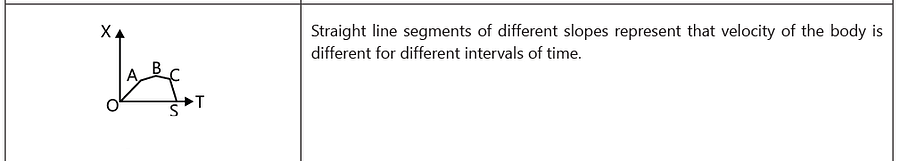
- If the graph is an oblique line, the velocity is constant (OC and EF in Fig. 2).
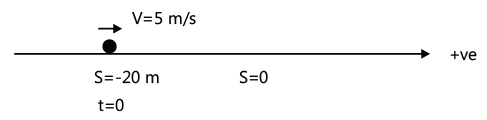
Example: Displacement–time graph of a particle moving in a straight line is shown in the Fig. State whether the motion is accelerated or not. Describe the motion of the particle in detail. Given s0=20 m and t0=4 s.
 Solution: The velocity of the particle at any instant is the slope of the displacement time graph at that instant. If the slope is constant, velocity is constant.
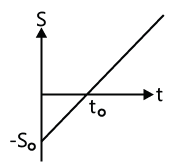
Slope s–t is a straight line. Hence, velocity of particle is constant. At time t = 0, displacement of the particle from its mean position is –s0 i.e. -20 m. Velocity of particle, V slope s0/t0 = 20/4 = 5m / s
At t = 0 particle is at –20 m and has a constant velocity of 5 m/s. At t0 = 4 sec, particle will pass through its mean position
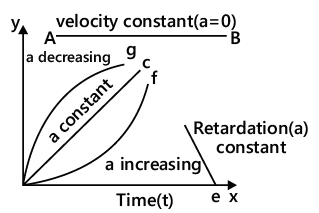
Velocity–Time Graph
Displacement, velocity and acceleration, specifying the entire motion, can be determined by the velocity–time curve.
- Instantaneous acceleration can be obtained by the slope of the tangent at any point corresponding to a particular time on the curve.
- Displacement during a time interval is obtained from the area enclosed by velocity–time graph and time axis for a time interval.
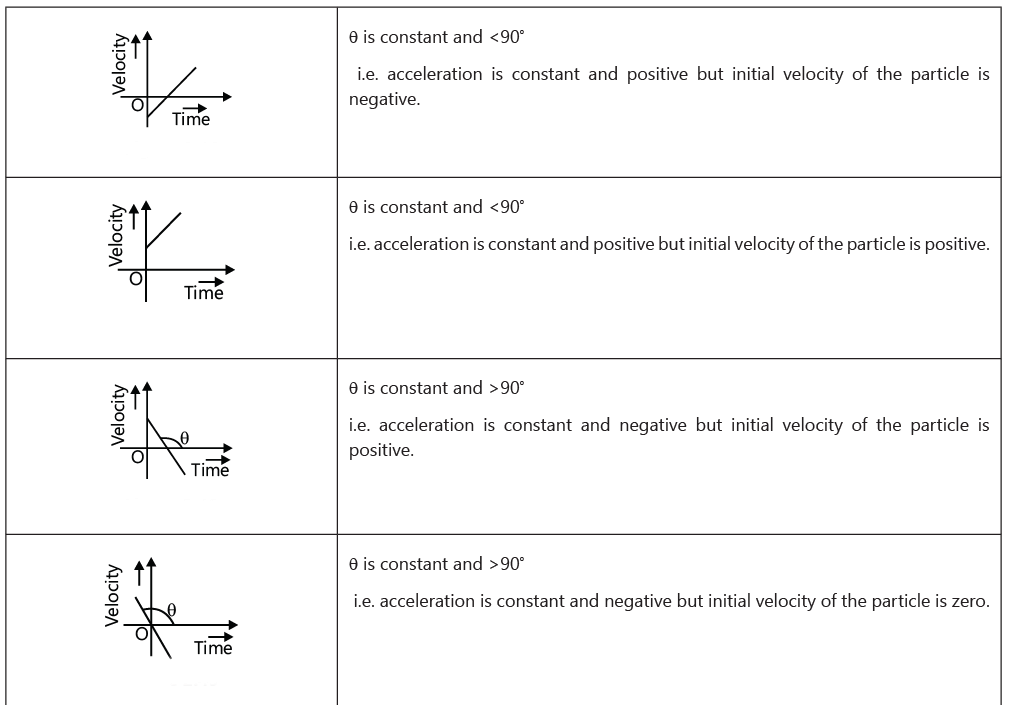
- For a uniformly accelerated motion, velocity–time graph is a straight line.
- For constant velocity (i.e. acceleration is zero), the graph obtained is a straight line AB parallel to x-axis (time).
- For constant acceleration, the graph obtained is oblique.
Acceleration–Time Graph
- Change in velocity for a given time interval is the area enclosed between acceleration–time graph and time axis.
- For constant acceleration, the obtained graph is a straight line parallel to x-axis, i.e. time (t).
- If the acceleration is non-uniform, then the graph is oblique.
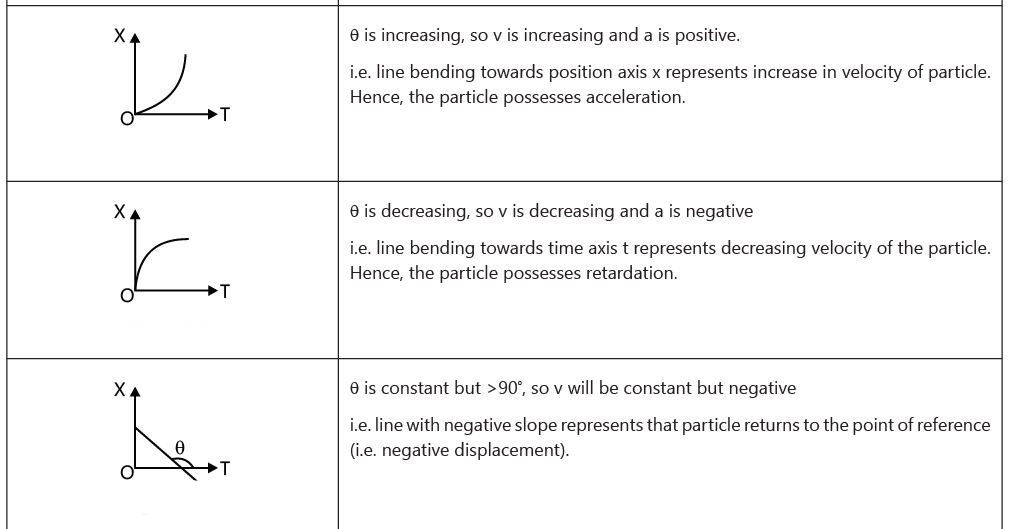
Inference: Displacement–time graph for uniformly accelerated or retarded motion is a parabola. Since, for constant acceleration, then relation between displacement and time is: s = ut ± 1/2at2 which is quadratic in nature. Thus, displacement–time graph will be parabolic in nature.
Example: Acceleration–time graph of a particle moving in a straight line is shown in Fig. At time t=0, velocity of the particle is 2 m/s. Find velocity at the end of the 4th second.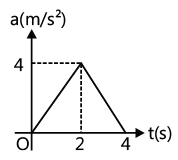 Solution: The area enclosed by the acceleration-time graph between t = 0 and t = 4s will give the change in velocity in this time interval.
dv = a dt
or change in velocity = area under a-t graph
Hence vf - vi = 1/2 (4) (4) = 8m/s; ∴ vf - vi + 8 = (2 + 8)m/ s = 10m/ s
The following are the lists of motions that are not possible practically:
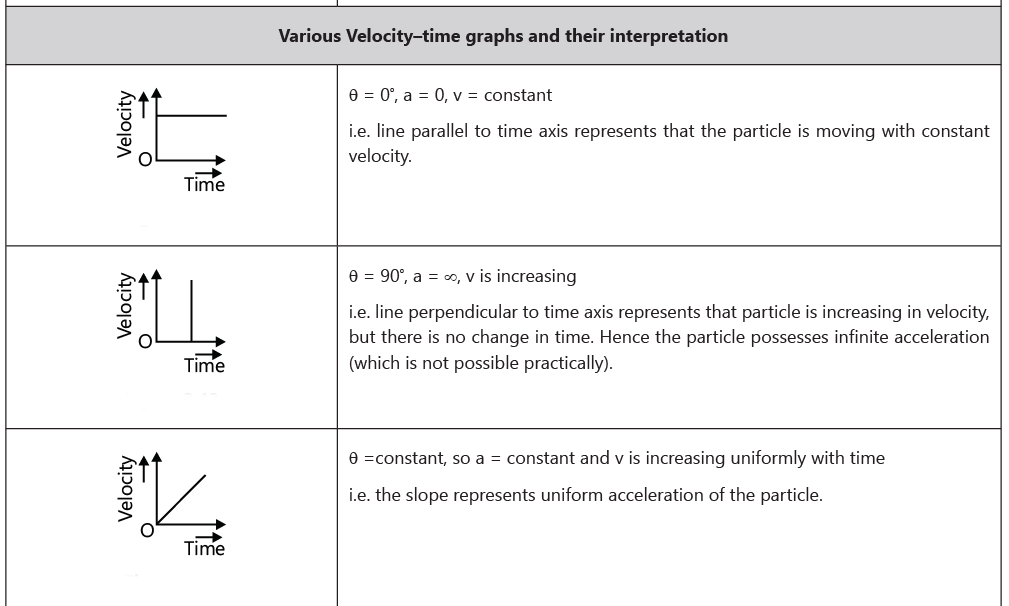
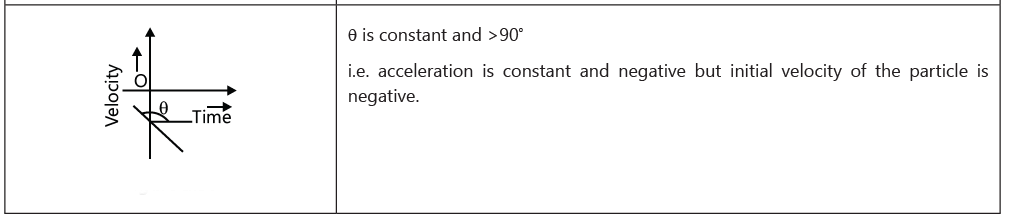
- Slopes of v-t or s-t graphs can never be infinite at any point, because infinite slope of v-t graph means infinite acceleration. Similarly, infinite slope of s-t graph means infinite velocity. Hence, the graphs shown here are not possible.
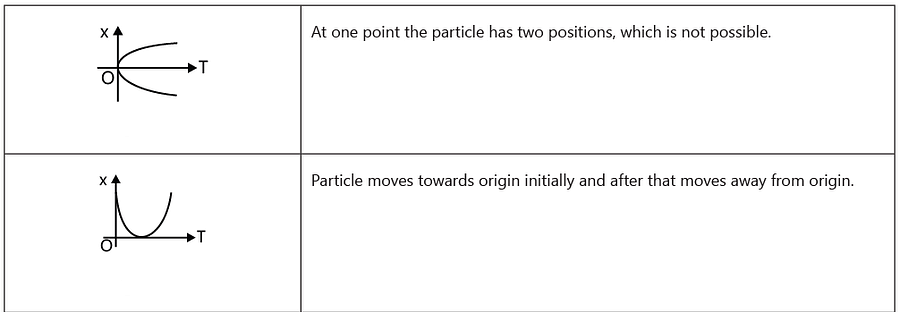
- At a particular time, two values of velocities v1 and v2 or displacements S1 and S2 are not possible. Hence, the following graphs shown here are not possible.
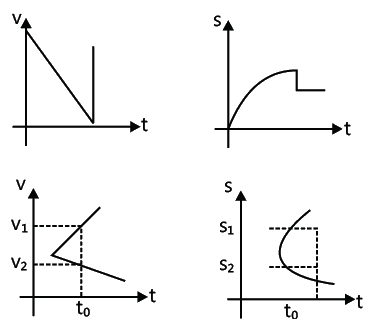
Example 1: At t = 0, a particle is at rest at origin. For the first 3 s the acceleration is 2 ms-2 and for the next 3 s acceleration is -2 ms-2. Find the acceleration versus time, velocity versus time and position versus time graphs.
Solution: The area enclosed by the acceleration-time graph and the time-axis between t = 0 and t = t gives the change in velocity in this time interval. Similarly the area enclosed by the velocity-time graph and the time-axis between t = 0 and t = t will give the change in displacement in this time interval. Given for the first 3 s acceleration is 2 ms-2 and for next 3 s acceleration is -2 ms-2. Hence acceleration-time graph is as shown in the Fig.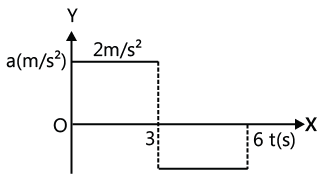 The area enclosed between a-t curve and t-axis gives change in velocity for the corresponding interval. Also at t = 0, v = 0, hence final velocity at t = 3 s will increase to 6 ms-1. In next 3 s the velocity will decrease to zero. Hence the velocity-time graph is as shown in figure.
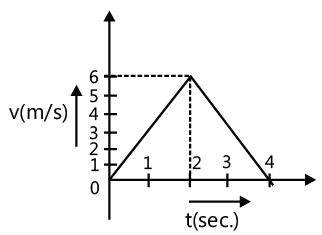 Note that due to constant acceleration v-t curves are taken as straight line.
Now for x-t curve, we will use the fact that area enclosed between v-t curve and time axis gives displacement for the corresponding interval. Hence displacement in the first 3 s is 4.5 m and in next 3 s is 4.5 m. Also the x–t curve will be of parabolic nature as the motion has a constant acceleration. Therefore, x–t curve is as shown in figure.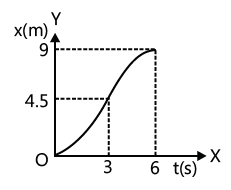
Example 2: The graph in the Fig. shows the velocity of a body plotted as a function of time.
(a) Find the instantaneous acceleration at t = 3 s, 7 s, 10 s, and 13 s.
(b) Find the distance travelled by the body in the first 5 s, 9 s, and 14 s
(c) Find the total distance covered by the body during motion.
(d) Find the average velocity of the body during motion.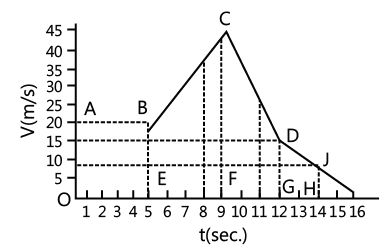
Solution: The area enclosed by the acceleration-time graph and the time-axis between t = 0 and t = t gives the change in velocity in this time interval. Similarly the area enclosed by the velocity-time graph and the time-axis between t = 0 and t = t will give the change in displacement in this time interval.
(a) Acceleration at t = 3 s
When the particle travels from point A to B for the first 5 s, the body moves with a constant velocity. Hence, the acceleration is zero.
Acceleration at t = 7 s.
When the particle travels from point B to C for the interval 5 to 9 s, the acceleration is uniform.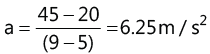
Hence acceleration at t=7 s is 6.25 m/s2. The acceleration at t = 10 s and 13 s are respectively -10 m/s2 and -3.75 m.s2.
(b) The distance covered in t seconds is the area enclosed by the curve in t seconds on velocity–time graph. The distance covered by the body in 5 s = Area of rectangle ABEO = 20 x 5 = 100 m
The distance covered in first 9 s = The area of the figure ABCFO = Area ABEO + Area EBCF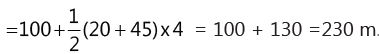
The distance covered by the body in first 14 s = Area [(ABCFO) + (CDGF) + DJHG)]
(c) The distance covered by the body during the entire motion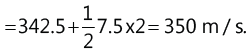
(d) Average velocity for the motion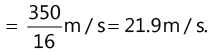
|
48 videos|69 docs|30 tests
|


ppt
,Viva Questions
,Extra Questions
,mock tests for examination
,MCQs
,Semester Notes
,video lectures
,Summary
,Exam
,shortcuts and tricks
,Previous Year Questions with Solutions
,practice quizzes
,Sample Paper
,study material
,Objective type Questions
,past year papers
,Graphs: Motion in One Dimension | AP Physics 1 - Grade 9
,Free
,Graphs: Motion in One Dimension | AP Physics 1 - Grade 9
,Important questions
,Graphs: Motion in One Dimension | AP Physics 1 - Grade 9
;


Graphs: Motion in One Dimension Free PDF Download
Importance of Graphs: Motion in One Dimension
Graphs: Motion in One Dimension Notes
Graphs: Motion in One Dimension Grade 9 Questions
Study Graphs: Motion in One Dimension on the App
|
© EduRev
|
Education Revolution
|


|


