Important Definitions & Formulas: Statistics | Mathematics (Maths) Class 10 PDF Download
| Table of contents |

|
| Statistics |

|
| Mean |

|
| Mode |

|
| Median |

|
Statistics
Statistics is a branch of mathematics that focuses on collecting, organising, analysing, interpreting, and presenting data.
Ungrouped Data
Ungrouped data is data in its original or raw form. The observations are not classified into groups.
Example: The ages of everyone present in a classroom of kindergarten kids with the teacher are as follows:
3, 3, 4, 3, 5, 4, 3, 3, 4, 3, 3, 3, 3, 4, 3, 27.
Grouped Data
- Grouped data means that observations are organised into groups.
- This type of data is easier to handle when there is a lot of information.
For example, a class of students got different marks in a school exam. The data is tabulated as follows: This shows how many students got the particular mark range. Grouped data is easier to work with when a large amount of data is present.
Frequency
- Frequency is the number of times a particular observation occurs in data.
- Example: if four students have scored marks between 90 and 100, then the marks scored between 90 and 100 have a frequency of 4.
Class Interval
- Data can be grouped into class intervals, where all observations within that range belong to that class.
- Class width = upper class limit – lower class limit.
- Example: Consider a class interval 31 – 40.
Here, the lower class limit is 31, and the upper class limit is 40.
Hence, the size/width of the class interval 31 – 40 is calculated as follows:
Class interval size = Upper class limit – Lower class limit
Class interval size = 40 – 31 = 9
Therefore, the size of the class interval is 9.
Mean
Mean of Grouped Data (Without Class Interval)
If the data is organized in such a way that there is no class interval then we can calculate the mean by 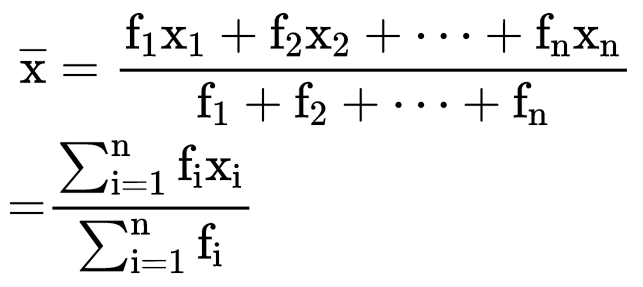 where, x1, x2, x3,...... xn are the observations
f1, f2, f3, ...... fn are the respective frequencies of the given observations.
Example: Calculate mean from the following data.
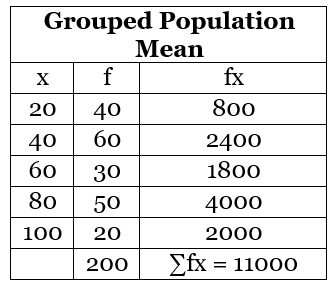
Here, x1, x2, x3, x4, x5 are 20, 40, 60, 80, 100 respectively and f1, f2, f3, f4, f5 are 40, 60, 30, 50, 20 respectively. 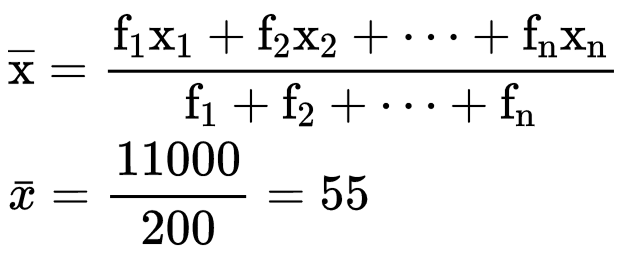
Mean of Grouped Data (With Class-Interval)
When the data is grouped in the form of class interval then the mean can be calculated by three methods.
1. Direct Method
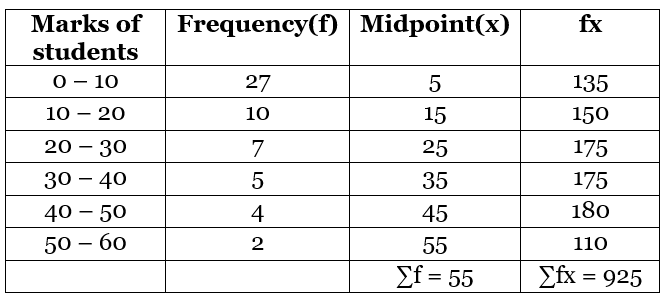
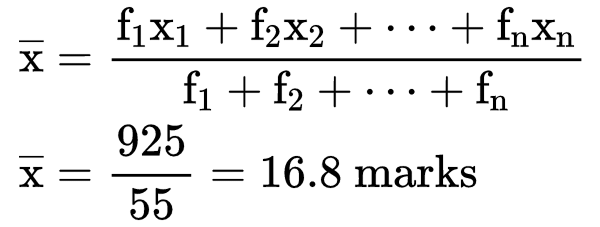
In this method, we use a midpoint which represents the whole class. It is called the class mark. It is the average of the upper limit and the lower limit.  Example: A teacher marks the test result of the class of 55 students for mathematics. Find the mean for the given group.
Solution: To find the mean we need to find the mid-point or class mark for each class interval which will be the x and then by multiplying frequency and midpoint we get fx.
2. Deviation or Assumed Mean Method
If we have to calculate the large numbers then we can use this method to make our calculations easy. In this method, we choose one of the x’s as assumed mean and let it as “a”. Then we find the deviation which is the difference of assumed mean and each of the x. The rest of the method is the same as the direct method. 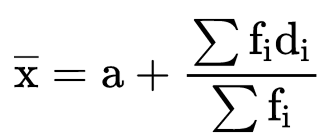
Example: If we have the table of the expenditure of the company's workers in the household, then what will be the mean of their expenses? Solution:
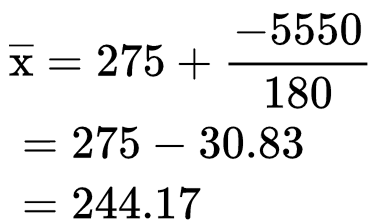
As we can see that there are big values of x to calculate so we will use the assumed mean method.
Here we take 275 as the assumed mean.

3. Step Deviation Method
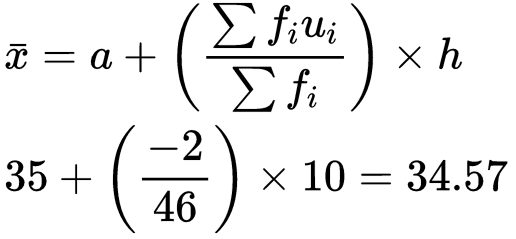
In this method, we divide the values of d with a number "h" to make our calculations easier. 
Example: The wages of the workers are given in the table. Find the mean by step deviation method. Solution:

Mode
In the ungrouped data the most frequently occurring no. is the mode of the sequence, but in the grouped data we can find the class interval only which has the maximum frequency number i.e. the modal class.
The value of mode in that modal class is calculated by  l = lower class limit of the modal class
h = class interval size
f1 =frequency of the modal class
f0 =frequency of the preceding class
f2 = frequency of the succeeding class
Example: The table of the marks of the students of a class is given. Find the modal class and the mode. Solution:
Here we can see that the class interval with the highest frequency 8 is 20 – 40.
So this is our modal class.
Modal class = 20 - 40
Lower limit of modal class (l) = 20
Class interval size (h) = 20
Frequency of the modal class(f1) = 8
Frequency of the preceding class(f0) = 4
Frequency of the succeeding class (f2) = 6 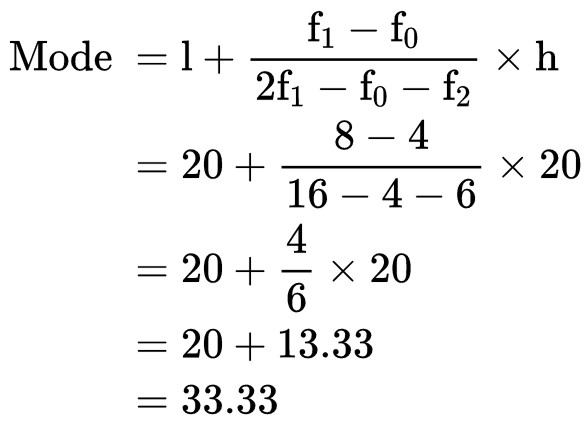
Median
To find the median of a grouped data, we need to find the cumulative frequency and n/2
Then we have to find the median class, which is the class of the cumulative frequency near or greater than the value of n/2.
Cumulative Frequency is calculated by adding the frequencies of all the classes preceding the given class.
Then substitute the values in the formula  where l = lower limit of median class
n = no. of observations
cf = cumulative frequency of the class preceding to the median class
f = frequency of the median class
h = size of class
Example: Find the median of the given table. Solution:
Let’s find the n/2.
n = 20, so n/2 = 20/2 = 10
The median class is 11 - 15 as its cumulative frequency is 13 which is greater than 10. 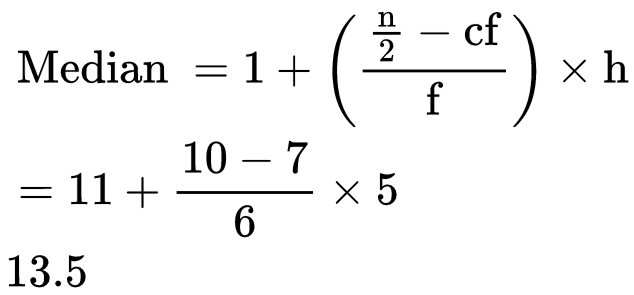 Remark: The empirical relation between the three measures of central tendency is
3 Median = Mode + 2 Mean
|
127 videos|584 docs|79 tests
|
FAQs on Important Definitions & Formulas: Statistics - Mathematics (Maths) Class 10
| 1. What is the difference between mean, median, and mode in statistics? |  |
| 2. How do you calculate the mean of a data set? |  |
| 3. When would you use the median instead of the mean? |  |
| 4. Can a data set have more than one mode? |  |
| 5. How do you find the mode in a data set? |  |


