Influence Lines | Structural Analysis - Civil Engineering (CE) PDF Download
Unfluence Line Diagram and Rolling Loads
Influence Line Diagram represents variation in the values of a particular stress function such as reactions, SF, BM, axial force, slope or deflections etc, when a unit concentrated load moves from one end to the other end of span.
Simply Supported BeamThe ordinate of influence line at any section (say y1) represents magnitude of that stress function when unit concentrated load is placed at that section
(i)
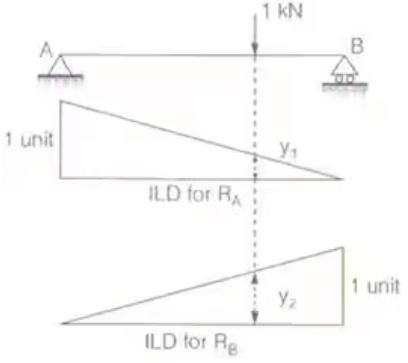
(ii)
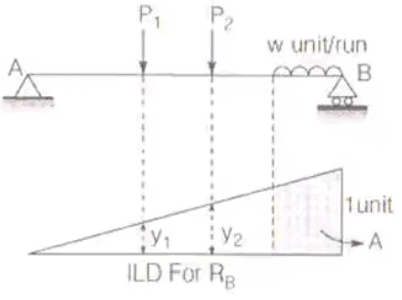 Total vertical reactions RB due to given load system is
RB = P1Y1 + P2Y2 + wA
(iii)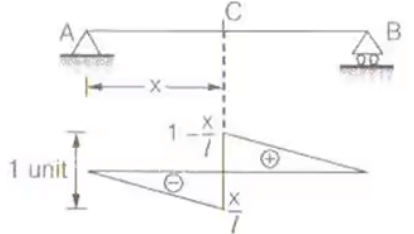
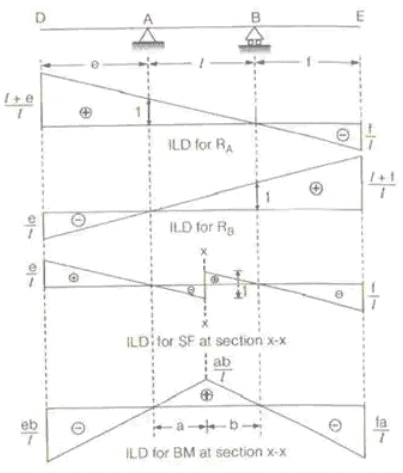
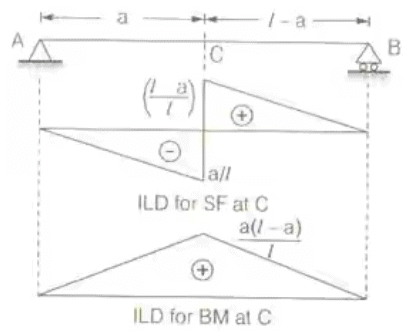
ILD for shear force at C
(iv)
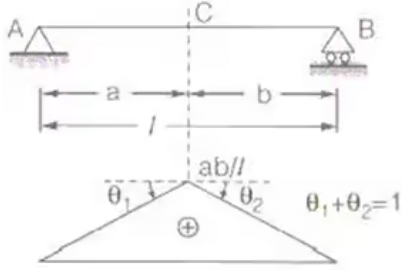 ILD for Bending Moment at C
(v)
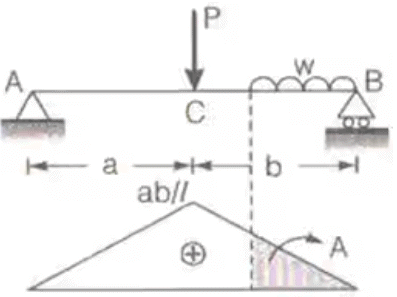
BMmax at C = P. ab/l + wA
(vi)
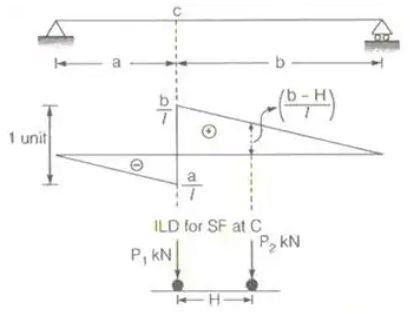 Position of load for maximum positive SF at C
 Position of load for maximum negative SF at C
(vii)
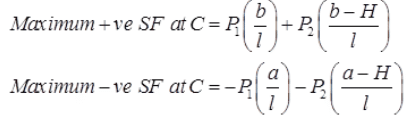
 Position of load for maximum positive SF at C
Maximum positive SF at C = wA1
Maximum negative SF at C = wA2
Simply Supported Beam with Overhang

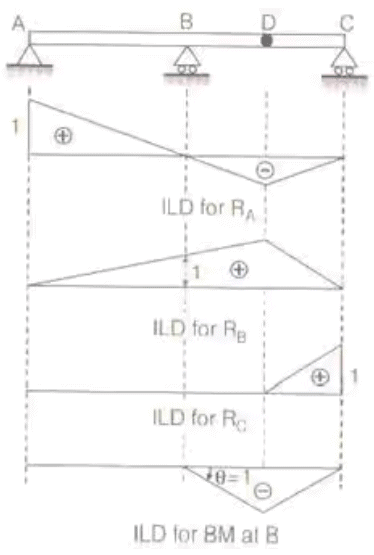
Simply Supported Beam Carrying Internal Hinge
Effect of rolling loads
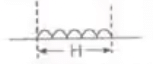
To find maximum SF and BM at section C when a UDL passes over the girder from let to right having length less then length of girder.
Length of load is l' (<L)
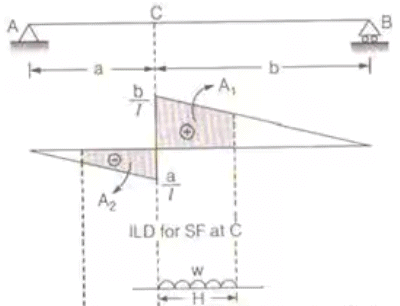
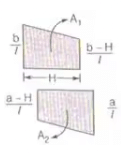
- The maximum negative shear force at section C will be, when head of the load is just to the left of section and loaded part is AC.
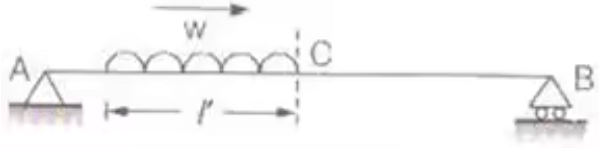 Maximum negative shear force at C = w x artea of ILD below loading
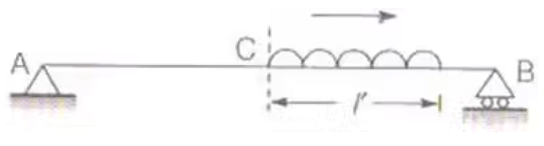
 - Maximum positive shear force at C will occur when tail of load is just to the right of C.
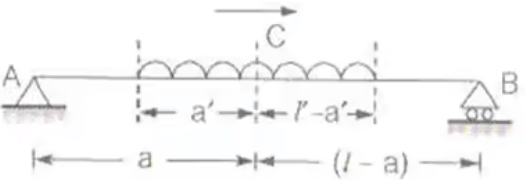
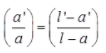
- Maximum BM at C will occur when average loading just to the left of C = average loading just to the right of C. It means section C will devide load in the same ratio as it devides to the span.
 |
Download the notes
Influence Lines
|
Download as PDF |
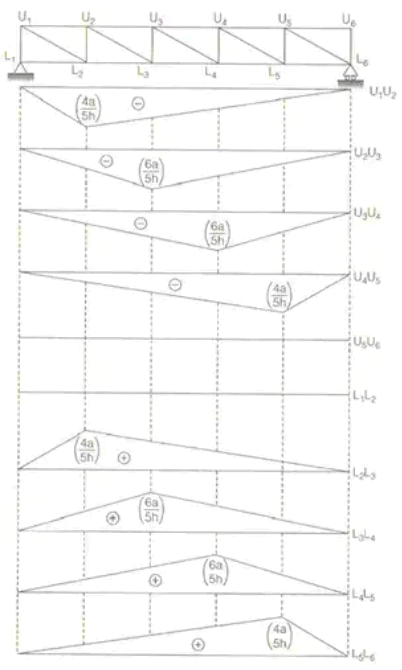
Influence line diagram for truss members
 |
Take a Practice Test
Test yourself on topics from Civil Engineering (CE) exam
|
Practice Now |
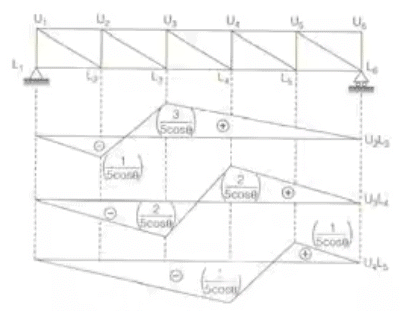
ILD for Inclined members
|
34 videos|140 docs|31 tests
|


Influence Lines | Structural Analysis - Civil Engineering (CE)
,Semester Notes
,past year papers
,Viva Questions
,Influence Lines | Structural Analysis - Civil Engineering (CE)
,Free
,Influence Lines | Structural Analysis - Civil Engineering (CE)
,ppt
,Exam
,Important questions
,Extra Questions
,study material
,video lectures
,Summary
,practice quizzes
,mock tests for examination
,Previous Year Questions with Solutions
,shortcuts and tricks
,Objective type Questions
,MCQs
,Sample Paper
;


Influence Lines Free PDF Download
Importance of Influence Lines
Influence Lines Notes
Influence Lines Civil Engineering (CE) Questions
Study Influence Lines on the App
|
© EduRev
|
Education Revolution
|


|


within 7 days!