NCERT Solutions Class 11 Maths Chapter 13 - Statistics

Exercise - 13.1
Q1: Find the mean deviation about the mean for the data 4, 7, 8, 9, 10, 12, 13, 17
Ans: The given data is
4, 7, 8, 9, 10, 12, 13, 17
Mean of the data, 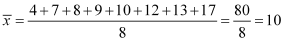
The deviations of the respective observations from the mean  are
are
–6, – 3, –2, –1, 0, 2, 3, 7
The absolute values of the deviations, i.e.  , are
, are
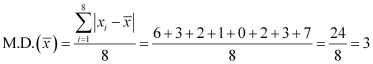
6, 3, 2, 1, 0, 2, 3, 7
The required mean deviation about the mean is
Q2: Find the mean deviation about the mean for the data 38, 70, 48, 40, 42, 55, 63, 46, 54, 44
Ans: The given data is
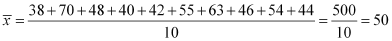
38, 70, 48, 40, 42, 55, 63, 46, 54, 44
Mean of the given data,
The deviations of the respective observations from the mean  are
are
–12, 20, –2, –10, –8, 5, 13, –4, 4, –6
The absolute values of the deviations, i.e.  , are
, are
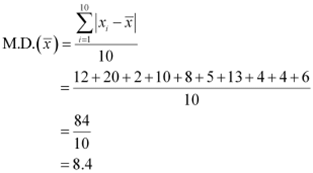
12, 20, 2, 10, 8, 5, 13, 4, 4, 6
The required mean deviation about the mean is
Q3: Find the mean deviation about the median for the data.
13, 17, 16, 14, 11, 13, 10, 16, 11, 18, 12, 17
Ans: The given data is
13, 17, 16, 14, 11, 13, 10, 16, 11, 18, 12, 17
Here, the numbers of observations are 12, which is even.
Arranging the data in ascending order, we obtain
10, 11, 11, 12, 13, 13, 14, 16, 16, 17, 17, 18

The deviations of the respective observations from the median, i.e.  are
are
–3.5, –2.5, –2.5, –1.5, –0.5, –0.5, 0.5, 2.5, 2.5, 3.5, 3.5, 4.5
The absolute values of the deviations,  , are
, are
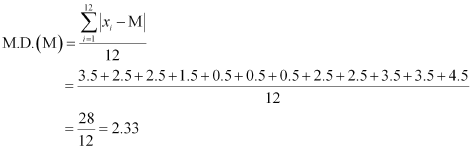
3.5, 2.5, 2.5, 1.5, 0.5, 0.5, 0.5, 2.5, 2.5, 3.5, 3.5, 4.5
The required mean deviation about the median is
Q4: Find the mean deviation about the median for the data
36, 72, 46, 42, 60, 45, 53, 46, 51, 49
Ans: The given data is
36, 72, 46, 42, 60, 45, 53, 46, 51, 49
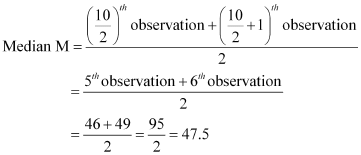
Here, the number of observations is 10, which is even.
Arranging the data in ascending order, we obtain
36, 42, 45, 46, 46, 49, 51, 53, 60, 72
The deviations of the respective observations from the median, i.e.  are
are
–11.5, –5.5, –2.5, –1.5, –1.5, 1.5, 3.5, 5.5, 12.5, 24.5
The absolute values of the deviations,  , are
, are
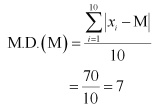
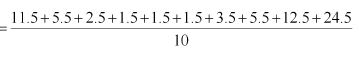
11.5, 5.5, 2.5, 1.5, 1.5, 1.5, 3.5, 5.5, 12.5, 24.5
Thus, the required mean deviation about the median is
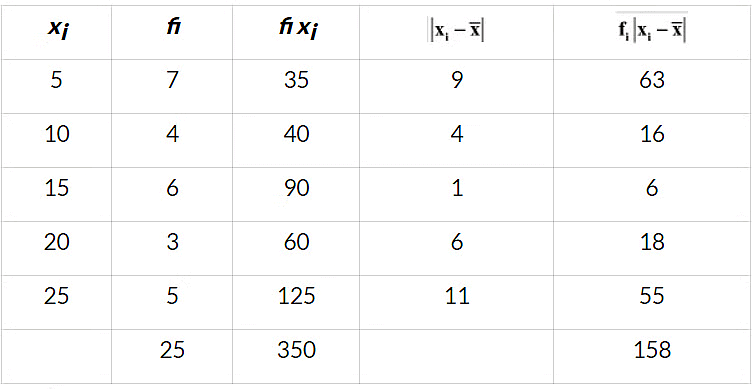
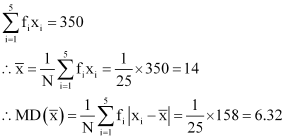
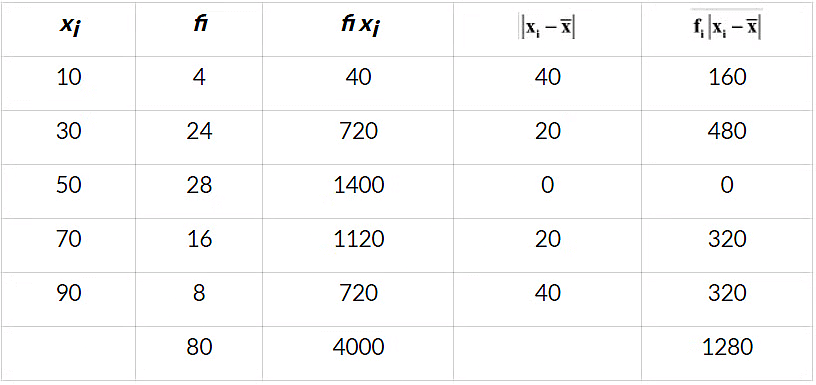
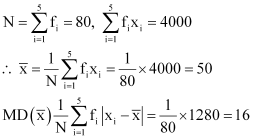
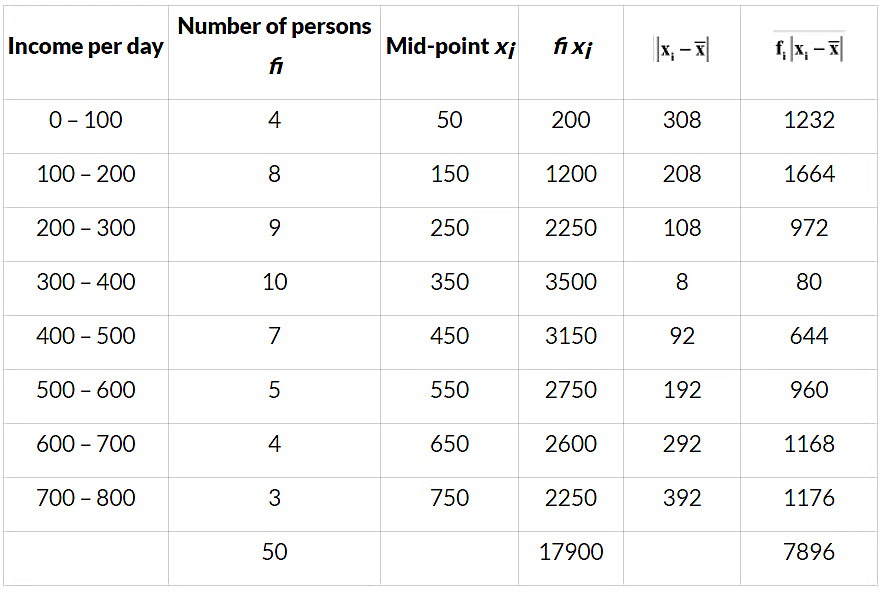
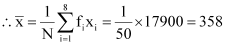
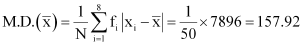
Q5: Find the mean deviation about the mean for the data.
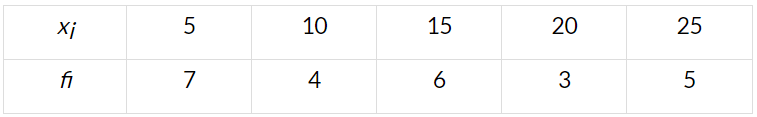 Ans:
Ans:

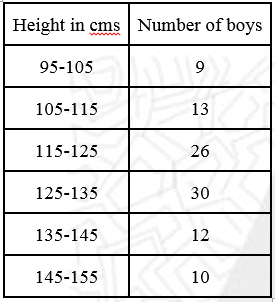
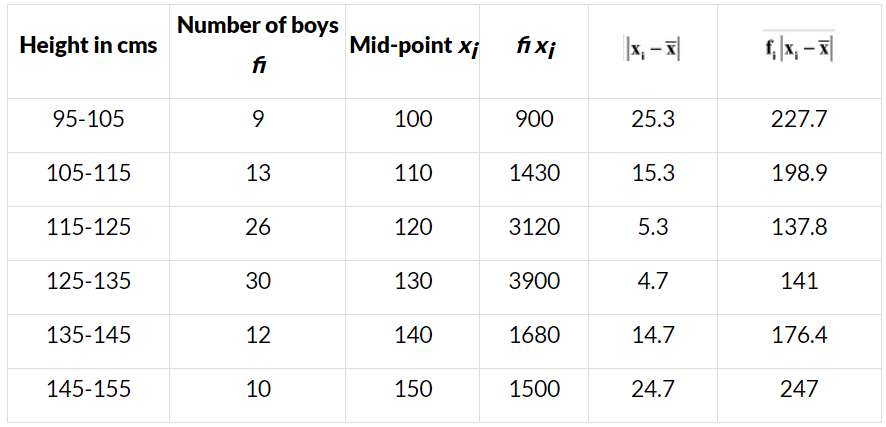
Q6: Find the mean deviation about the mean for the data
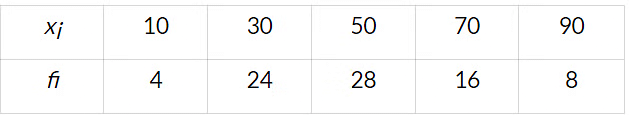
Ans:
Q7: Find the mean deviation about the median for the data.
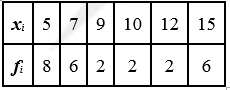 Ans: The given observations are already in ascending order.
Adding a column corresponding to cumulative frequencies of the given data, we obtain the following table.
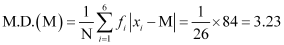
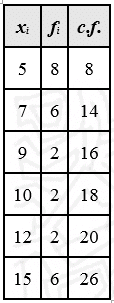 Here, N = 26, which is even.
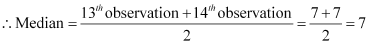
Median is the mean of 13th and 14th observations. Both of these observations lie in the cumulative frequency 14, for which the corresponding observation is 7.
The absolute values of the deviations from median, i.e.  are
are
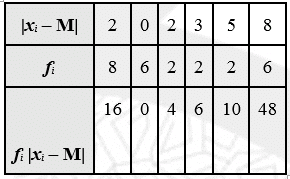
 and
and 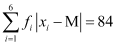
Q8: Find the mean deviation about the median for the data
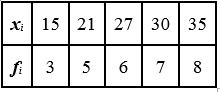
Ans: The given observations are already in ascending order.
Adding a column corresponding to cumulative frequencies of the given data, we obtain the following table.
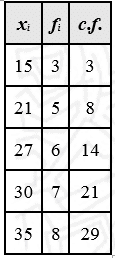 Here, N = 29, which is odd.
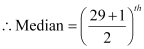 observation = 15th observation
This observation lies in the cumulative frequency 21, for which the corresponding observation is 30.
∴ Median = 30
The absolute values of the deviations from median, i.e.  are
are
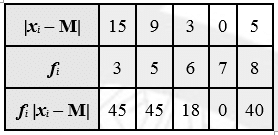
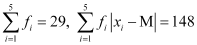
∴ 
Q9: Find the mean deviation about the mean for the data.
Ans: The following table is formed
Here, 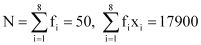
Q10: Find the mean deviation about the mean for the data
Ans: The following table is formed.
Here, 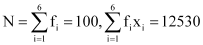
Q11: Find the mean deviation about median for the following data:
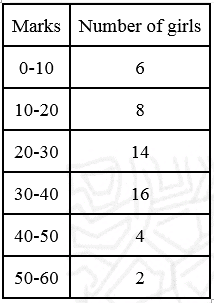
Ans: The following table is formed.
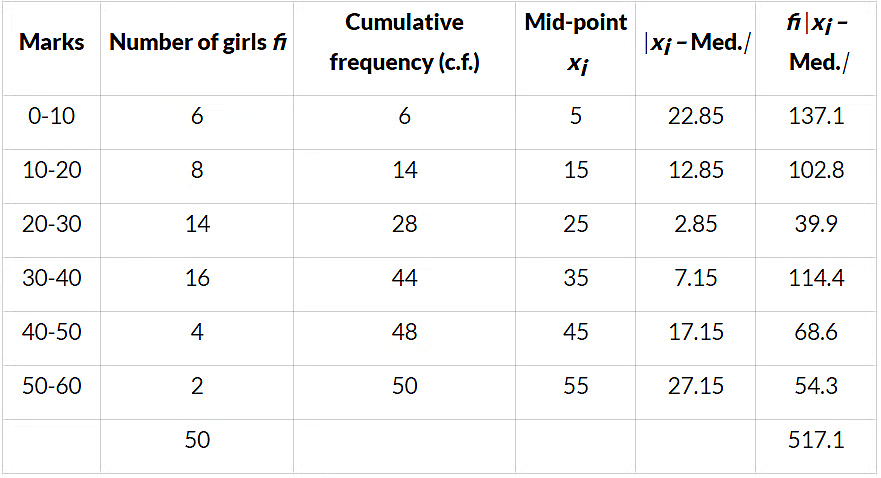
The class interval containing the  or 25th item is 20 – 30.
Therefore, 20 – 30 is the median class.
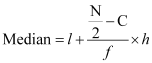
It is known that,

Here, l = 20, C = 14, f = 14, h = 10, and N = 50
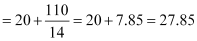
∴ Median = 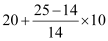
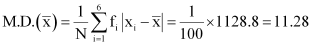
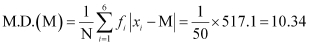
Thus, mean deviation about the median is given by,
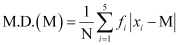
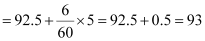
Q12: Calculate the mean deviation about median age for the age distribution of 100 persons given below:
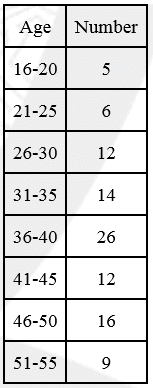
Ans: The given data is not continuous. Therefore, it has to be converted into continuous frequency distribution by subtracting 0.5 from the lower limit and adding 0.5 to the upper limit of each class interval.
The table is formed as follows.
Age | Number fi | Cumulative frequency (c.f.) | Mid-point xi | |xi – Med.| | fi |xi – Med.| |
15.5-20.5 | 5 | 5 | 18 | 20 | 100 |
20.5-25.5 | 6 | 11 | 23 | 15 | 90 |
25.5-30.5 | 12 | 23 | 28 | 10 | 120 |
30.5-35.5 | 14 | 37 | 33 | 5 | 70 |
35.5-40.5 | 26 | 63 | 38 | 0 | 0 |
40.5-45.5 | 12 | 75 | 43 | 5 | 60 |
45.5-50.5 | 16 | 91 | 48 | 10 | 160 |
50.5-55.5 | 9 | 100 | 53 | 15 | 135 |
| 100 |
|
|
| 735 |
The class interval containing the  or 50th item is 35.5 – 40.5.
Therefore, 35.5 – 40.5 is the median class.
It is known that,
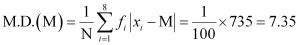
Here, l = 35.5, C = 37, f = 26, h = 5, and N = 100
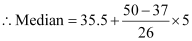
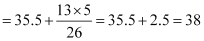
Thus, mean deviation about the median is given by,
Exercise - 13.2
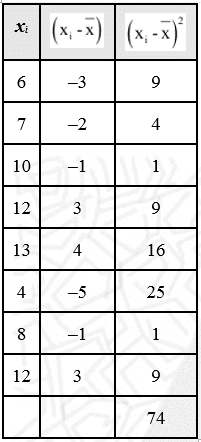
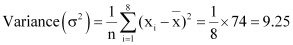
Q1: Find the mean and variance for the data 6, 7, 10, 12, 13, 4, 8, 12
Ans: 6, 7, 10, 12, 13, 4, 8, 12
Mean, 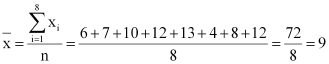
The following table is obtained.
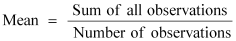
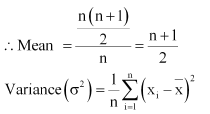
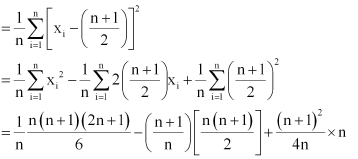
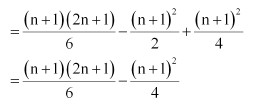
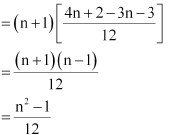
Q2: Find the mean and variance for the first n natural numbers
Ans: The mean of first n natural numbers is calculated as follows.
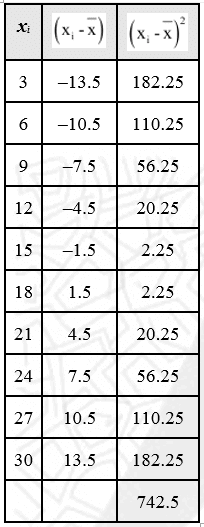
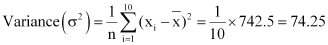
Q3: Find the mean and variance for the first 10 multiples of 3
Ans: The first 10 multiples of 3 are
3, 6, 9, 12, 15, 18, 21, 24, 27, 30
Here, number of observations, n = 10
The following table is obtained.
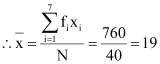
Q4: Find the mean and variance for the data
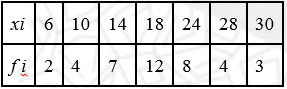
Ans: The data is obtained in tabular form as follows.
xi | f i | fixi |
|
|
|
6 | 2 | 12 | –13 | 169 | 338 |
10 | 4 | 40 | –9 | 81 | 324 |
14 | 7 | 98 | –5 | 25 | 175 |
18 | 12 | 216 | –1 | 1 | 12 |
24 | 8 | 192 | 5 | 25 | 200 |
28 | 4 | 112 | 9 | 81 | 324 |
30 | 3 | 90 | 11 | 121 | 363 |
40 | 760 | 1736 |


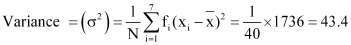
Here, N = 40, 
Q5: Find the mean and variance for the data
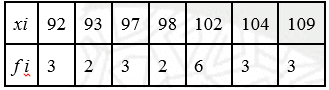
Ans: The data is obtained in tabular form as follows.
xi | f i | fixi |
|
|
|
92 | 3 | 276 | –8 | 64 | 192 |
93 | 2 | 186 | –7 | 49 | 98 |
97 | 3 | 291 | –3 | 9 | 27 |
98 | 2 | 196 | –2 | 4 | 8 |
102 | 6 | 612 | 2 | 4 | 24 |
104 | 3 | 312 | 4 | 16 | 48 |
109 | 3 | 327 | 9 | 81 | 243 |
22 | 2200 | 640 |


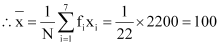
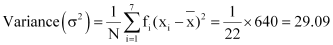
Here, N = 22, 
Q6: Find the mean and standard deviation using short-cut method.
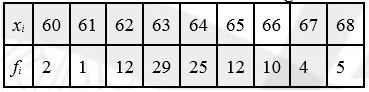
Ans: The data is obtained in tabular form as follows.
xi | fi |
| yi2 | fiyi | fiyi2 |
60 | 2 | –4 | 16 | –8 | 32 |
61 | 1 | –3 | 9 | –3 | 9 |
62 | 12 | –2 | 4 | –24 | 48 |
63 | 29 | –1 | 1 | –29 | 29 |
64 | 25 | 0 | 0 | 0 | 0 |
65 | 12 | 1 | 1 | 12 | 12 |
66 | 10 | 2 | 4 | 20 | 40 |
67 | 4 | 3 | 9 | 12 | 36 |
68 | 5 | 4 | 16 | 20 | 80 |
100 | 220 | 0 | 286 |

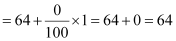
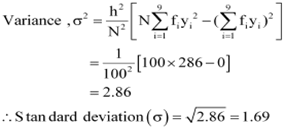
Mean, 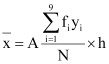
Q7: Find the mean and variance for the following frequency distribution.
Classes | 0-30 | 30-60 | 60-90 | 90-120 | 120-150 | 150-180 | 180-210 |
Frequencies | 2 | 3 | 5 | 10 | 3 | 5 | 2 |
Ans:
Class | Frequency fi | Mid-point xi |
| yi2 | fiyi | fiyi2 |
0-30 | 2 | 15 | –3 | 9 | –6 | 18 |
30-60 | 3 | 45 | –2 | 4 | –6 | 12 |
60-90 | 5 | 75 | –1 | 1 | –5 | 5 |
90-120 | 10 | 105 | 0 | 0 | 0 | 0 |
120-150 | 3 | 135 | 1 | 1 | 3 | 3 |
150-180 | 5 | 165 | 2 | 4 | 10 | 20 |
180-210 | 2 | 195 | 3 | 9 | 6 | 18 |
30 | 2 | 76 |

Mean, 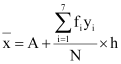
Q8: Find the mean and variance for the following frequency distribution.
Classes | 0-10 | 10-20 | 20-30 | 30-40 | 40-50 |
Frequencies | 5 | 8 | 15 | 16 | 6 |
Ans:
Class | Frequency fi | Mid-point xi |
| yi2 | fiyi | fiyi2 |
0-10 | 5 | 5 | –2 | 4 | –10 | 20 |
10-20 | 8 | 15 | –1 | 1 | –8 | 8 |
20-30 | 15 | 25 | 0 | 0 | 0 | 0 |
30-40 | 16 | 35 | 1 | 1 | 16 | 16 |
40-50 | 6 | 45 | 2 | 4 | 12 | 24 |
50 | 10 | 68 |

Mean, 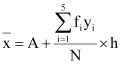
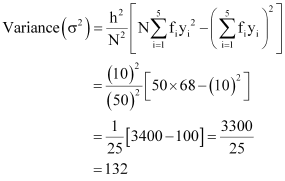
Q9: Find the mean, variance and standard deviation using short-cut method
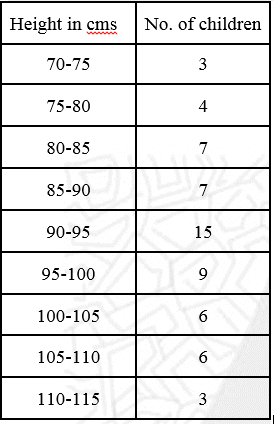
Ans:
Class Interval | Frequency fi | Mid-point xi |
| yi2 | fiyi | fiyi2 |
70-75 | 3 | 72.5 | –4 | 16 | –12 | 48 |
75-80 | 4 | 77.5 | –3 | 9 | –12 | 36 |
80-85 | 7 | 82.5 | –2 | 4 | –14 | 28 |
85-90 | 7 | 87.5 | –1 | 1 | –7 | 7 |
90-95 | 15 | 92.5 | 0 | 0 | 0 | 0 |
95-100 | 9 | 97.5 | 1 | 1 | 9 | 9 |
100-105 | 6 | 102.5 | 2 | 4 | 12 | 24 |
105-110 | 6 | 107.5 | 3 | 9 | 18 | 54 |
110-115 | 3 | 112.5 | 4 | 16 | 12 | 48 |
60 | 6 | 254 |

Mean, 
Q10: The diameters of circles (in mm) drawn in a design are given below:
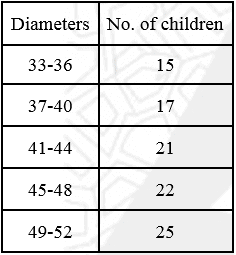
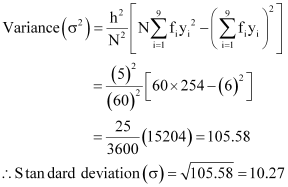
Ans:
Class Interval | Frequency fi | Mid-point xi |
| fi2 | fiyi | fiyi2 |
32.5-36.5 | 15 | 34.5 | –2 | 4 | –30 | 60 |
36.5-40.5 | 17 | 38.5 | –1 | 1 | –17 | 17 |
40.5-44.5 | 21 | 42.5 | 0 | 0 | 0 | 0 |
44.5-48.5 | 22 | 46.5 | 1 | 1 | 22 | 22 |
48.5-52.5 | 25 | 50.5 | 2 | 4 | 50 | 100 |
| 100 |
|
|
| 25 | 199 |
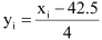
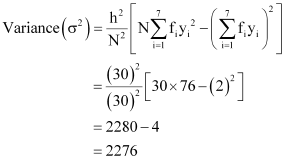
Here, N = 100, h = 4
Let the assumed mean, A, be 42.5.
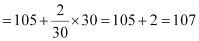
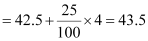
Mean, 
Old NCERT Questions
Q1: From the data given below state which group is more variable, A or B?
Marks | 10-20 | 20-30 | 30-40 | 40-50 | 50-60 | 60-70 | 70-80 |
Group A | 9 | 17 | 32 | 33 | 40 | 10 | 9 |
Group B | 10 | 20 | 30 | 25 | 43 | 15 | 7 |
Ans: Firstly, the standard deviation of group A is calculated as follows.
Marks | Group A fi | Mid-point xi |
| yi2 | fiyi | fiyi2 |
10-20 | 9 | 15 | –3 | 9 | –27 | 81 |
20-30 | 17 | 25 | –2 | 4 | –34 | 68 |
30-40 | 32 | 35 | –1 | 1 | –32 | 32 |
40-50 | 33 | 45 | 0 | 0 | 0 | 0 |
50-60 | 40 | 55 | 1 | 1 | 40 | 40 |
60-70 | 10 | 65 | 2 | 4 | 20 | 40 |
70-80 | 9 | 75 | 3 | 9 | 27 | 81 |
150 | –6 | 342 |

Here, h = 10, N = 150, A = 45
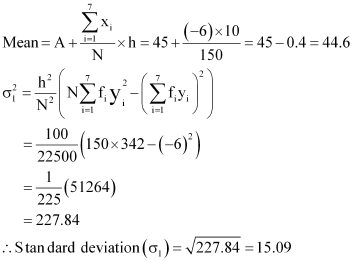
The standard deviation of group B is calculated as follows.
Marks | Group B fi | Mid-point xi |
| yi2 | fiyi | fiyi2 |
10-20 | 10 | 15 | –3 | 9 | –30 | 90 |
20-30 | 20 | 25 | –2 | 4 | –40 | 80 |
30-40 | 30 | 35 | –1 | 1 | –30 | 30 |
40-50 | 25 | 45 | 0 | 0 | 0 | 0 |
50-60 | 43 | 55 | 1 | 1 | 43 | 43 |
60-70 | 15 | 65 | 2 | 4 | 30 | 60 |
70-80 | 7 | 75 | 3 | 9 | 21 | 63 |
150 | –6 | 366 |

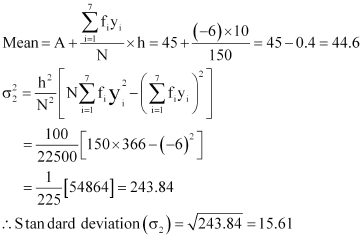
Since the mean of both the groups is same, the group with greater standard deviation will be more variable.
Thus, group B has more variability in the marks.
Q2: From the prices of shares X and Y below, find out which is more stable in value:
X | 35 | 54 | 52 | 53 | 56 | 58 | 52 | 50 | 51 | 49 |
Y | 108 | 107 | 105 | 105 | 106 | 107 | 104 | 103 | 104 | 101 |
Ans: The prices of the shares X are
35, 54, 52, 53, 56, 58, 52, 50, 51, 49
Here, the number of observations, N = 10
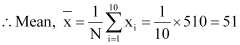
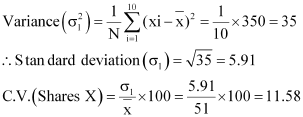
The following table is obtained corresponding to shares X.
xi |
|
|
35 | –16 | 256 |
54 | 3 | 9 |
52 | 1 | 1 |
53 | 2 | 4 |
56 | 5 | 25 |
58 | 7 | 49 |
52 | 1 | 1 |
50 | –1 | 1 |
51 | 0 | 0 |
49 | –2 | 4 |
350 |


The prices of share Y are
108, 107, 105, 105, 106, 107, 104, 103, 104, 101
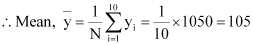
The following table is obtained corresponding to shares Y.
yi |
|
|
108 | 3 | 9 |
107 | 2 | 4 |
105 | 0 | 0 |
105 | 0 | 0 |
106 | 1 | 1 |
107 | 2 | 4 |
104 | –1 | 1 |
103 | –2 | 4 |
104 | –1 | 1 |
101 | –4 | 16 |
40 |


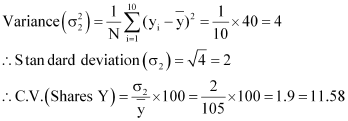
C.V. of prices of shares X is greater than the C.V. of prices of shares Y.
Thus, the prices of shares Y are more stable than the prices of shares X.
Q3: An analysis of monthly wages paid to workers in two firms A and B, belonging to the same industry, gives the following results:
Firm A | Firm B | |
No. of wage earners | 586 | 648 |
Mean of monthly wages | Rs 5253 | Rs 5253 |
Variance of the distribution of wages | 100 | 121 |
- Which firm A or B pays larger amount as monthly wages?
- Which firm, A or B, shows greater variability in individual wages?
Ans: (i) Monthly wages of firm A = Rs 5253
Number of wage earners in firm A = 586
∴Total amount paid = Rs 5253 × 586
Monthly wages of firm B = Rs 5253
Number of wage earners in firm B = 648
∴Total amount paid = Rs 5253 × 648
Thus, firm B pays the larger amount as monthly wages as the number of wage earners in firm B are more than the number of wage earners in firm A.
(ii) Variance of the distribution of wages in firm A  = 100
= 100
∴ Standard deviation of the distribution of wages in firm
A ((σ1) = 
Variance of the distribution of wages in firm  = 121
= 121
∴ Standard deviation of the distribution of wages in firm 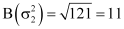
The mean of monthly wages of both the firms is same i.e., 5253. Therefore, the firm with greater standard deviation will have more variability.
Thus, firm B has greater variability in the individual wages.
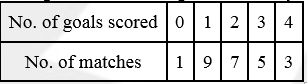
Q4: The following is the record of goals scored by team A in a football session:
For the team B, mean number of goals scored per match was 2 with a standard deviation 1.25 goals. Find which team may be considered more consistent?
Ans: The mean and the standard deviation of goals scored by team A are calculated as follows.
No. of goals scored | No. of matches | fixi | xi2 | fixi2 |
0 | 1 | 0 | 0 | 0 |
1 | 9 | 9 | 1 | 9 |
2 | 7 | 14 | 4 | 28 |
3 | 5 | 15 | 9 | 45 |
4 | 3 | 12 | 16 | 48 |
25 | 50 | 130 |
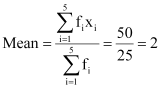
Thus, the mean of both the teams is same.
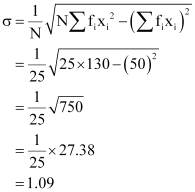
The standard deviation of team B is 1.25 goals.
The average number of goals scored by both the teams is same i.e., 2. Therefore, the team with lower standard deviation will be more consistent.
Thus, team A is more consistent than team B.
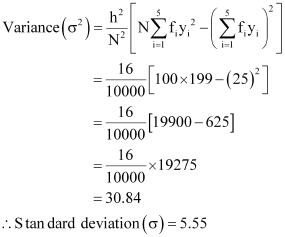
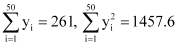
Q5: The sum and sum of squares corresponding to length x (in cm) and weight y (in gm) of 50 plant products are given below:
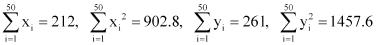
Which is more varying, the length or weight?
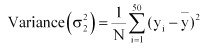
Ans: 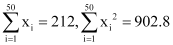
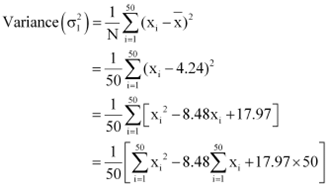
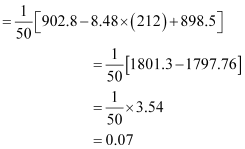
Here, N = 50
∴ Mean, 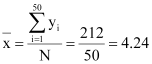
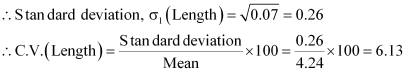
Mean, 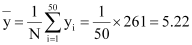
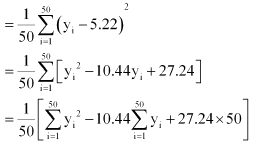
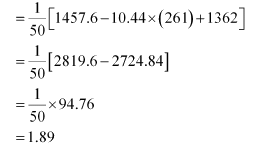
Thus, C.V. of weights is greater than the C.V. of lengths. Therefore, weights vary more than the lengths.
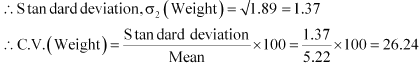
Q6: The mean and variance of eight observations are 9 and 9.25, respectively. If six of the observations are 6, 7, 10, 12, 12 and 13, find the remaining two observations.
Ans: Let the remaining two observations be x and y.
Therefore, the observations are 6, 7, 10, 12, 12, 13, x, y.
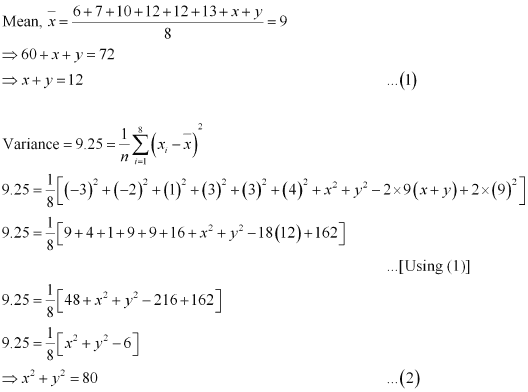
From (1), we obtain
x2 + y2 + 2xy = 144 …(3)
From (2) and (3), we obtain
2xy = 64 … (4)
Subtracting (4) from (2), we obtain
x2 + y2 – 2xy = 80 – 64 = 16
⇒ x – y = ± 4 … (5)
Therefore, from (1) and (5), we obtain
x = 8 and y = 4, when x – y = 4
x = 4 and y = 8, when x – y = –4
Thus, the remaining observations are 4 and 8.
Q7: The mean and variance of 7 observations are 8 and 16, respectively. If five of the observations are 2, 4, 10, 12 and 14. Find the remaining two observations.
Ans: Let the remaining two observations be x and y.
The observations are 2, 4, 10, 12, 14, x, y.
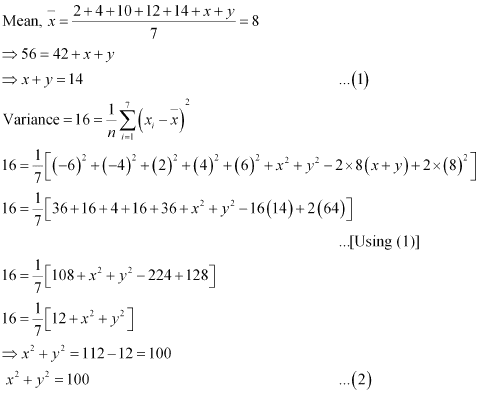
From (1), we obtain
x2 + y2 + 2xy = 196 … (3)
From (2) and (3), we obtain
2xy = 196 – 100
⇒ 2xy = 96 … (4)
Subtracting (4) from (2), we obtain
x2 + y2 – 2xy = 100 – 96
⇒ (x – y)2 = 4
⇒ x – y = ± 2 … (5)
Therefore, from (1) and (5), we obtain
x = 8 and y = 6 when x – y = 2
x = 6 and y = 8 when x – y = – 2
Thus, the remaining observations are 6 and 8.
Q8: The mean and standard deviation of six observations are 8 and 4, respectively. If each observation is multiplied by 3, find the new mean and new standard deviation of the resulting observations.
Ans: Let the observations be x1, x2, x3, x4, x5, and x6.
It is given that mean is 8 and standard deviation is 4.
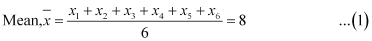
If each observation is multiplied by 3 and the resulting observations are yi, then
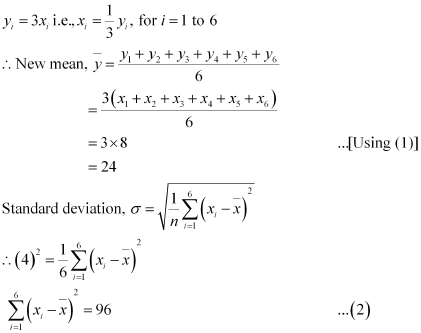
From (1) and (2), it can be observed that,

Substituting the values of xi and  in (2), we obtain
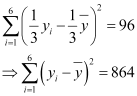
Therefore, variance of new observations = 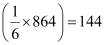
Hence, the standard deviation of new observations is 
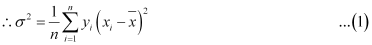
Q9: Given that  is the mean and σ2 is the variance of n observations x1, x2 … xn. Prove that the mean and variance of the observations ax1, ax2, ax3 …axn are
  and a2 σ2, respectively (a ≠ 0).
Ans: The given n observations are x1, x2 … xn.
Mean = 
Variance = σ2
If each observation is multiplied by a and the new observations are yi, then
Therefore, mean of the observations, ax1, ax2 … axn, is  .
.
Substituting the values of xiand  in (1), we obtain
Thus, the variance of the observations, ax1, ax2 … axn, is a2 σ2.
Q10: The mean and standard deviation of 20 observations are found to be 10 and 2, respectively. On rechecking, it was found that an observation 8 was incorrect. Calculate the correct mean and standard deviation in each of the following cases:
(i) If wrong item is omitted.
(ii) If it is replaced by 12.
Ans: (i) Number of observations (n) = 20
Incorrect mean = 10
Incorrect standard deviation = 2
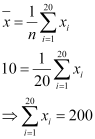
That is, incorrect sum of observations = 200
Correct sum of observations = 200 – 8 = 192
∴ Correct mean 

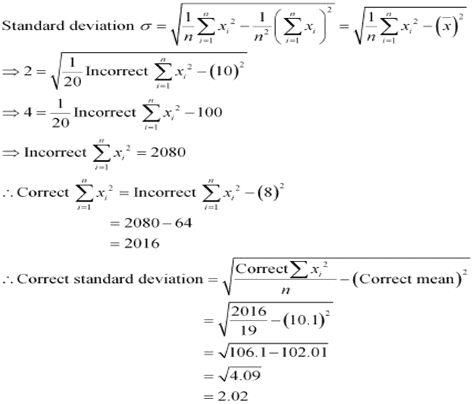
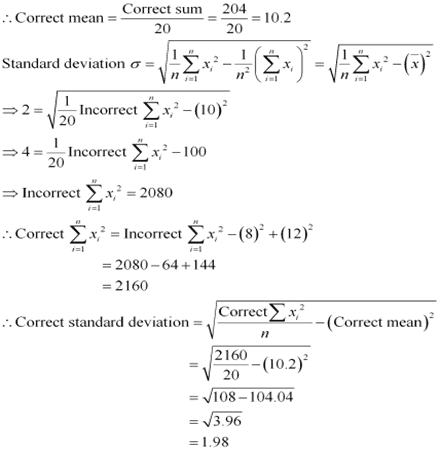
(ii) When 8 is replaced by 12,
Incorrect sum of observations = 200
∴ Correct sum of observations = 200 – 8 + 12 = 204
Q11: The mean and standard deviation of marks obtained by 50 students of a class in three subjects, Mathematics, Physics and Chemistry are given below:
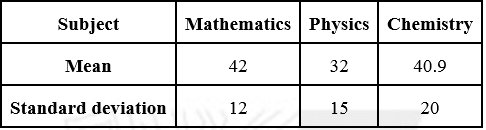
Which of the three subjects shows the highest variability in marks and which shows the lowest?
Ans: Standard deviation of Mathematics = 12
Standard deviation of Physics = 15
Standard deviation of Chemistry = 20
The coefficient of variation (C.V.) is given by  .
.
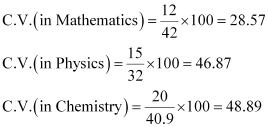
The subject with greater C.V. is more variable than others.
Therefore, the highest variability in marks is in Chemistry and the lowest variability in marks is in Mathematics.
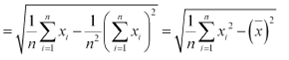
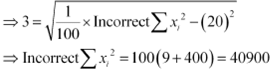
Q12: The mean and standard deviation of a group of 100 observations were found to be 20 and 3, respectively. Later on it was found that three observations were incorrect, which were recorded as 21, 21 and 18. Find the mean and standard deviation if the incorrect observations are omitted.
Ans: Number of observations (n) = 100
Incorrect mean 
Incorrect standard deviation 
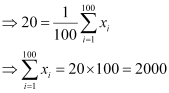
∴ Incorrect sum of observations = 2000
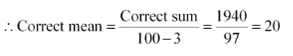
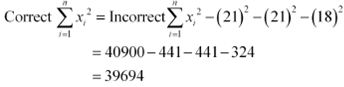
⇒ Correct sum of observations = 2000 – 21 – 21 – 18 = 2000 – 60 = 1940
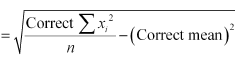
Standered deviation
Correct Standered deviation
|
172 videos|476 docs|154 tests
|
FAQs on NCERT Solutions Class 11 Maths Chapter 13 - Statistics
| 1. What are the different types of statistics? |  |
| 2. How is central tendency calculated in statistics? | |
| 3. What is the importance of statistics in research? | |
| 4. How can outliers affect statistical analysis? | |
| 5. What are the different measures of variability in statistics? | |


NCERT Solutions Class 11 Maths Chapter 13 - Statistics
,NCERT Solutions Class 11 Maths Chapter 13 - Statistics
,Summary
,video lectures
,Viva Questions
,Sample Paper
,mock tests for examination
,MCQs
,NCERT Solutions Class 11 Maths Chapter 13 - Statistics
,Exam
,Important questions
,Previous Year Questions with Solutions
,Extra Questions
,past year papers
,shortcuts and tricks
,Free
,ppt
,Semester Notes
,practice quizzes
,Objective type Questions
,study material
;


NCERT Solutions: Statistics Free PDF Download
Importance of NCERT Solutions: Statistics
NCERT Solutions: Statistics Notes
NCERT Solutions: Statistics JEE Questions
Study NCERT Solutions: Statistics on the App
|
© EduRev
|
Education Revolution
|


|


