NCERT Solutions for Class 7 Maths - Data Handling (Exercise 3.1 and 3.2)
| Table of contents |
|
| Exercise 3.1 |
|
| Exercise 3.2 |
|
| Exercise 3.3 |
|
| Exercise 3.4 (Old NCERT) |
|

Exercise 3.1
Q1: Find the range of heights of any ten students of your class.
Ans:
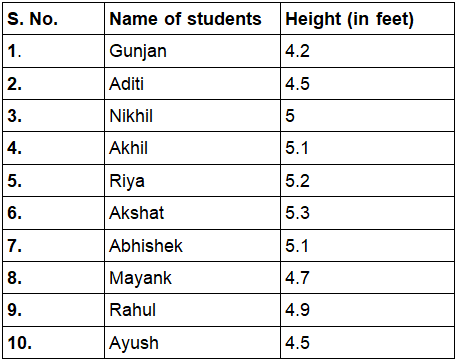
Range = Highest height – Lowest height
= 5.3 – 4.2
= 1.1 feet
Q2. Organize the following marks in a class assessment in a tabular form:
4, 6, 7, 5, 3, 5, 4, 5, 2, 6, 2, 5, 1, 9, 6, 5, 8, 4, 6, 7.
(i) Which number is the highest?
(ii) Which number of the lowest?
(iii) What is the range of the numbers?
(iv) Find the arithmetic mean
Ans:
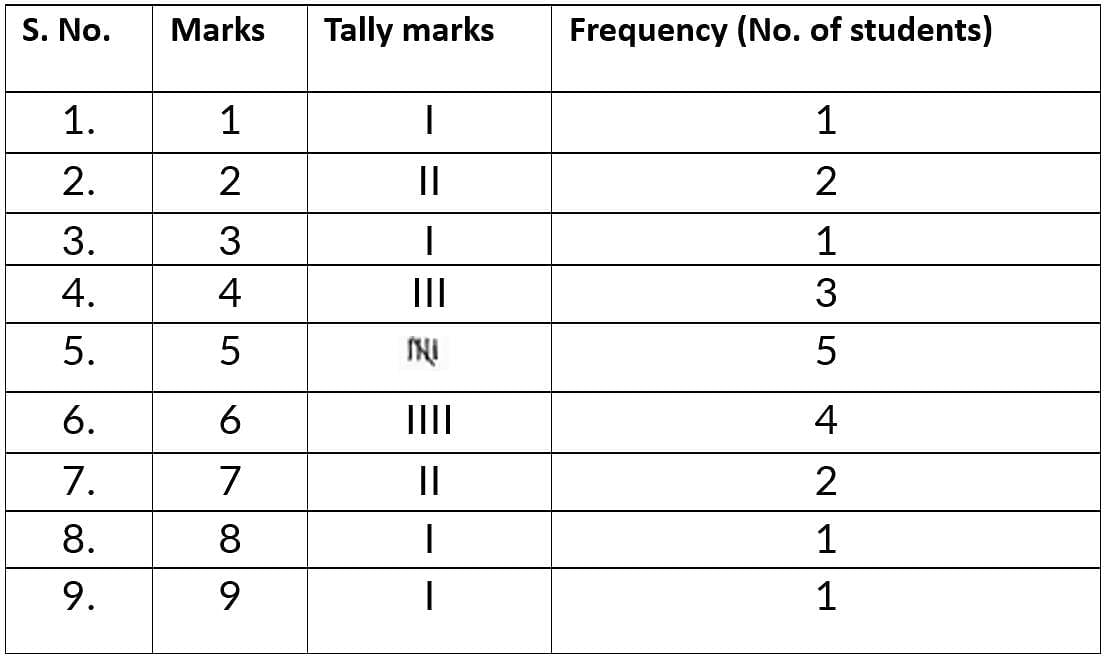
(i) The highest number is 9.
(ii) The lowest number is 1.
(iii) The range of the data is 9 - 1 = 8
(iv) Arithmetic mean
= 
= 100/20 = 5
Q3. Find the mean of the first five whole numbers.
Ans: The first five whole numbers are 0, 1, 2, 3 and 4.
Therefore,
Mean of first five whole numbers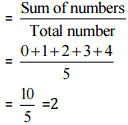
Thus, the mean of first five whole numbers is 2.
Q4. A cricketer scores the following runs in eight innings: 58, 76, 40, 35, 46, 45, 0, 100. Find the mean score.
Ans: Number of innings = 8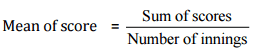
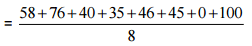
= 400 / 8 = 50
Thus, the mean score is 50.
Q5: Following table shows the points of each player scored in four games: 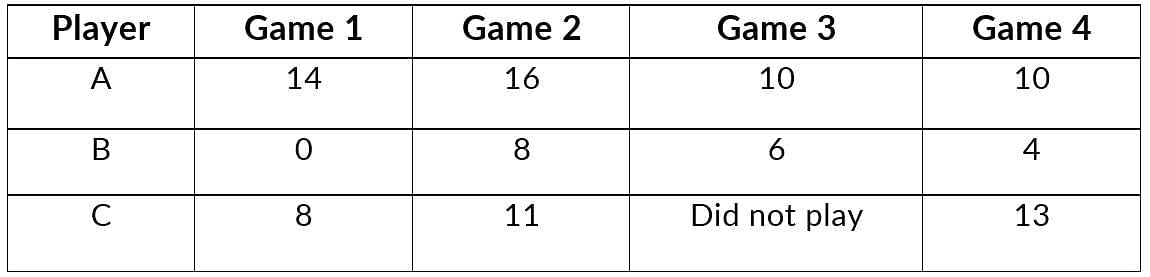
Now answer the following questions:
(i) Find the mean to determine A’s average number of points scored per game.
(ii) To find the mean number of points per game for C, would you divide the total points by 3 or by 4? Why?
(iii) B played in all the four games. How would you find the mean?
(iv) Who is the best performer?
Ans:
(i) A’s average number of points scored per game
= Total points scored by A in 4 games / Total number of games
= (14 + 16 + 10 + 10) / 4
= 50 / 4
= 12.5 points
(ii) We should divide the total points by 3 because player C played only three games.
(iii) Player B played in all the four games.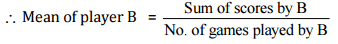
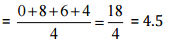
(iv) To find the best performer, we should know the mean of all players.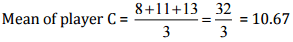
Therefore, on comparing average scores of all players, player A is the best performer.
Q6: The marks (out of 100) obtained by a group of students in a science test are 85, 76, 90, 85, 39, 48, 56, 95, 81 and 75.
Find the:
(i) The highest and the lowest marks obtained by the students.
(ii) Range of the marks obtained.
(iii) Mean marks obtained by the group.
Ans: (i) Highest marks obtained by the student = 95
Lowest marks obtained by the student = 39
(ii) Range of marks = Highest marks – Lowest marks
= 95 – 39
= 56
(iii)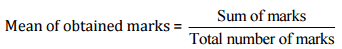
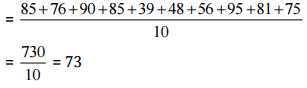
Thus, the mean marks obtained by the group of students is 73.
Q7: The enrolment in a school during six consecutive years was as follows: 1555, 1670, 1750, 2013, 2540, 2820 Find the mean enrolment of the school for this period.
Ans:
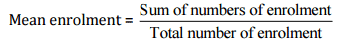
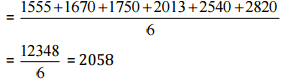
Thus, the mean enrolment of the school is 2,058.
Q8: The rainfall (in mm) in a city on 7 days of a certain week was recorded as follows: 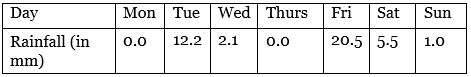
(i) Find the range of the rainfall in the above data.
(ii) Find the mean rainfall for the week.
(iii) On how many days was the rainfall less than the mean rainfall?
Ans: (i) The range of the rainfall = Highest rainfall – Lowest rainfall
= 20.5 – 0.0 = 20.5 mm
(ii) 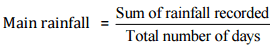
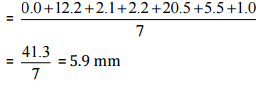
(iii) Since mean rainfall = 5.9 mm
Therefore, 5 days. i.e., Monday, Wednesday, Thursday, Saturday and Sunday rainfalls were less than the mean rainfall.
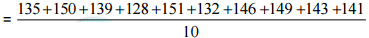
Q9: The height of 10 girls were measured in cm and the results are as follows: 135, 150, 139, 128, 151, 132, 146, 149, 143, 141
(i) What is the height of the tallest girl?
(ii) What is the height of the shortest girl?
(iii) What is the range of data?
(iv) What is the mean height of the girls?
(v) How many girls have heights more than the mean height?
Ans: First we have to arrange the given data in an ascending order,
= 128, 132, 135, 139, 141, 143, 146, 149, 150, 151
(i) The height of the tallest girl = 151 cm
(ii) The height of the shortest girl = 128 cm
(iii) The range of the data = Highest height – Lowest height
= 151 – 128 = 23 cm
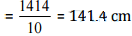
(iv) 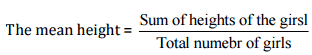
(v) Five girls, i.e., 150, 151, 146, 149, 143 have heights (in cm) more than the mean height.
Exercise 3.2
Q1: The scores in mathematics test (out of 25) of students is as follows:
19, 25, 23, 20, 9, 20, 15, 10, 5, 16, 25, 20, 24, 12, 20
Find the mode and median of this data. Are they same?
Ans: Arranging the given scores in an ascending order, we get
5, 9, 10, 12, 15, 16, 19, 20, 20, 20, 20, 23, 24, 25, 25
Mode
Since Mode is the value of the variable which occurs most frequently.
Clearly, 20 occurs maximum number of times.
Hence, mode of the given scores is 20
Median
The value of the middle-most observation is called the median of the data.
Here n = 15, which is odd.
Where, n is the number of the students.
∴ median = value of ½ (n + 1)th observation.
= ½ (15 + 1)
= ½ (16)
= 16 / 2
= 8
Then, value of 8th term = 20
Hence, the median is 20. Yes, both the values are same.
Q2: The runs scored in a cricket match by 11 players is as follows:
6, 15, 120, 50, 100, 80, 10, 15, 8, 10, 15
Find the mean, mode and median of this data. Are the three same?
Ans: Arranging the runs scored in a cricket match by 11 players in an ascending order, we get
6, 8, 10, 10, 15, 15, 15, 50, 80, 100, 120
Mean
Mean of the given data = Sum of all observations / Total number of observations
= (6 + 8 + 10 + 10 + 15 + 15 + 15 + 50 + 80 + 100 + 120) / 11
= 429 / 11
= 39
Mode
Mode is the value of the variable which occurs most frequently.
Clearly, 15 occurs maximum number of times.
Hence, mode of the given sores is 15
Median
The value of the middle-most observation is called the median of the data.
Here n = 11, which is odd.
Where, n is the number of players.
∴ median = value of ½ (n + 1)th observation.
= ½ (11 + 1)
= ½ (12)
= 12 / 2
= 6
Then, value of 6th term = 15
Hence, the median is 15.
No, these three are not same.
Q3: The weight (in kg) of 15 students of a class are:
38, 42, 35, 37, 45, 50, 32, 43, 43, 40, 36, 38, 43, 38, 47
(i) Find the mode and median of this data.
(ii) Is there more than one mode?
Ans: Arranging the given data in ascending order,
32, 35, 36, 37, 38, 38, 38, 40, 42, 43, 43, 43, 45, 47, 50
(i) Mode
Mode is the value of the variable which occurs most frequently.
Clearly, 38 and 43 both occurs 3 times.
Hence, mode of the given weights are 38 and 43.
Median
The value of the middle-most observation is called the median of the data.
Here n = 15, which is odd.
Where, n is the number of the students.
∴ median = value of ½ (n + 1)th observation.
= ½ (15 + 1) = ½ (16)
= 16 / 2
= 8
Then, value of 8th term = 40
Hence, the median is 40.
(ii) Yes, there are 2 modes for the given weights of the students.
Q4. Find the mode and median of the data:
13, 16, 12, 14, 19, 12, 14, 13, 14.
Ans: Arranging the given data in an ascending order, we get
= 12, 12, 13, 13, 14, 14, 14, 16, 19
Mode
Mode is the value of the variable which occurs most frequently.
Clearly, 14 occurs maximum number of times.
Hence, mode of the given data is 14.
Median
The value of the middle-most observation is called the median of the data.
Here n = 9, which is odd.
Where, n is the number of the students.
∴ median = value of ½ (9 + 1)th observation.
= ½ (9 + 1)
= ½ (10)
= 10 / 2
= 5
Then, value of 5th term = 14
Hence, the median is 14.
Q5. Tell whether the statement is true or false:
(i) The mode is always one of the numbers in a data.
Ans: True
Because, Mode is the value of the variable which occurs most frequently in the given data.
Hence, mode is always one of the numbers in a data.
(ii) The mean is one of the numbers in a data.
Ans: False
Because, mean is may be or may not be one of the number in a data.
(iii) The median is always one of the numbers in a data.
Ans: True
Because, median is the value of the middle-most observation in the given data while arranged in ascending or descending order.
Hence, median is always one of the numbers in a data
(iv) The data 6, 4, 3, 8, 9, 12, 13, 9 has mean 9.
Ans: False
Mean = Sum of all given observations / number of observations
= (6 + 4 + 3 + 8 + 9 + 12 + 13 + 9) / 8
= (64 / 8) = 8
Hence, the given statement is false.
Exercise 3.3
Q1: Use the bar graph (fig 3.3) to answer the following questions:
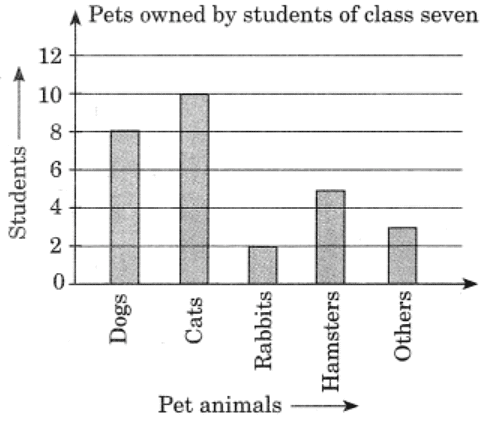
(a) Which is the most popular pet?
(b) How many students have dog as a pet?
Ans: (a) Cat is the most popular pet.
(b) 8 students have dog as a pet.
Q2: Read the bar graph which shows the number of books sold by a bookstore during five consecutive years and answer the following questions:
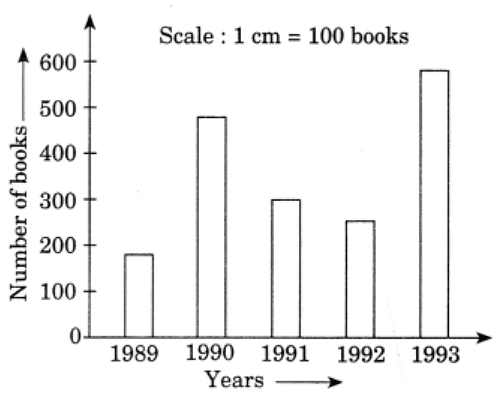
(i) About how many books were sold in 1989? 1990? 1992?
(ii) In which year were about 475 books sold? About 225 books sold?
(iii) In which years were fewer than 250 books sold?
(iv) Can you explain how you would estimate the number of books sold in 1989?
Ans: According to the given bar graph,
(i) (a) In 1989, 180 books were sold.
(b) In 1990, 475 books were sold.
(c) In 1992, 225 books were sold.
(ii) In 1990, about 475 books were sold and in 1992, about 225 books were sold.
(iii) In 1989 and 1992 fewer than 250 books were sold.
(iv) By reading the graph, we calculate that 180 books were sold in 1989.
Q3. Number of children in six different classes are given below. Represent the data on a bar graph. 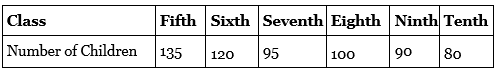
(a) How would you choose a scale?
(b) Answer the following questions.
(i) Which class has the maximum number of children? And the minimum?
(ii) Find the ratio of students of class sixth to the students of class eight.
Ans: Data represented by the bar graph is as follows:
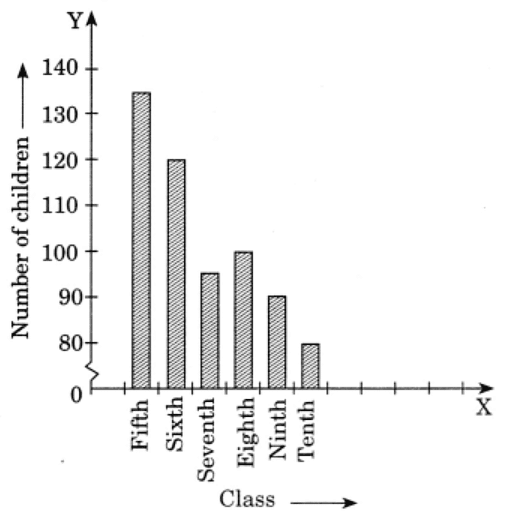
(a) Scale: 1 unit = 25 children
(b) (i) Fifth class has the maximum number of children and
Tenth class has the minimum number of children.
= 120/100
= 6/5 = 6:5
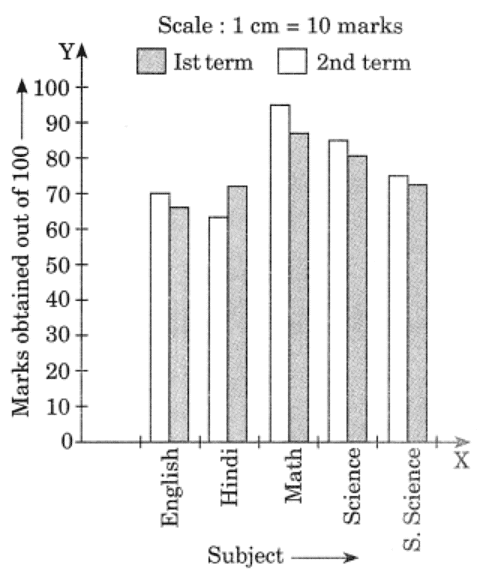
Q4: The performance of a student in 1st term and 2nd term is given. Draw a double bar graph choosing appropriate scale and answer the following: 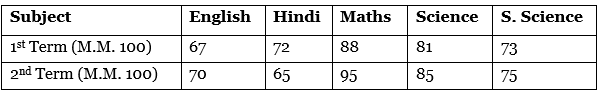
(i) In which subject has the child improved his performance the most?
(ii) In which subject is the improvement the least?
(iii) Has the performance gone down in any subject?
Ans: Data represented by bar graph is as follows:
Difference of marks of 1st term and 2nd term
English = 70 – 67 = 3
Hindi = 65 – 72 = -7
Maths = 95 – 88 = 7
Science = 85 – 81 = 4
S. Science = 75 – 73 = 2
(i) He has most improved in Maths subject.
(ii) In S. Science subject, his improvement is less.
(iii) Yes, in Hindi subject, his performance has gone down.
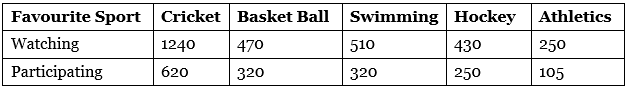
Q5: Consider this data collected from a survey of a colony.
 (i) Draw a double bar graph choosing an appropriate scale. What do you infer from the bar graph?
(ii) Which sport is most popular?
(iii) Which is more preferred, watching or participating in sports?
Ans: Data represented by the double bar graph is as follows:
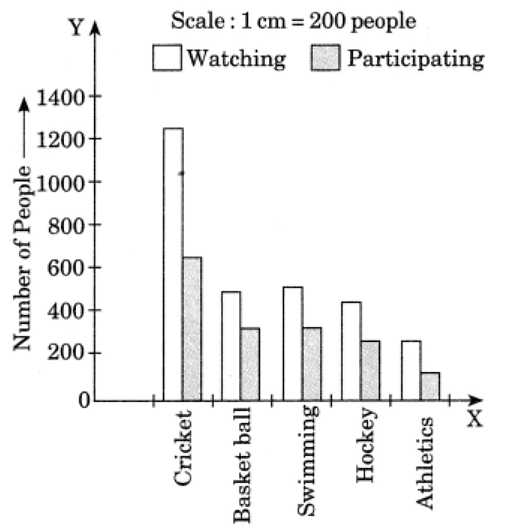
(i) This bar graph represents the number of persons who are watching and participating in their favourite sports.
(ii) Cricket is most popular.
(iii) Watching sports is more preferred.
Q6: Take the data giving the minimum and the maximum temperature of various cities given in the beginning of this Chapter. Plot a double bat graph using the data and answer the following:
Temperature of Cities as on 20.6.2006
City | Ahmedabad | Amritsar | Bangalore | Chennai |
Max. | 38°C | 37°C | 28°C | 36°C |
Min. | 29°C | 26°C | 21°C | 27°C |
City | Delhi | Jaipur | Jammu | Mumbai |
Max. | 38°C | 39°C | 41°C | 32°C |
Min. | 28°C | 29“ C | 26°C | 27°C |
(i) Which city has the largest difference in the minimum and maximum temperature on the given data?
(ii) Which is the hottest city and which is the coldest city?
(iii) Name two cities where maximum temperature of one was less than the minimum temperature of the order.
(iv) Name the city which has the least difference between its minimum and the maximum temperature.
Ans: Data represented by double bar graph is as follows:
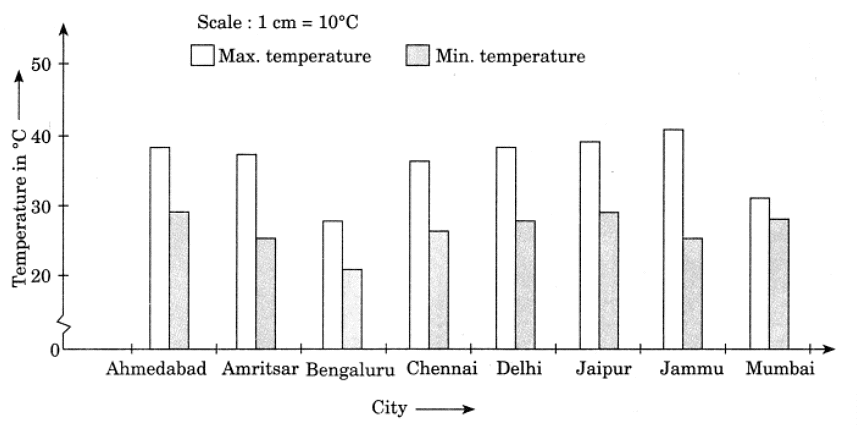
(i) Jammu has the largest difference in temperature i.e.,
Maximum temperature = 41oC and
Minimum temperature = 26oC.
∴ Difference = 41oC – 26oC = 15oC
(ii) Jammu is the hottest city due to maximum temperature is high and Bangalore is the coldest city due to maximum temperature is low.
(iii) Maximum temperature of Bangalore is 28oC
Minimum temperature of two cities whose minimum temperature is higher than the maximum temperature of Bangalore are Ahemedabad and Jaipur where the minimum temperature is 29oC
(iv) Mumbai has the least difference in temperature i.e.,
Maximum temperature = 32oC and
Minimum temperature = 27oC
∴ Difference = 32oC – 27oC = 5oC
Exercise 3.4 (Old NCERT)
Q1: Tell whether the following is certain to happen, impossible can happen but not certain.
(i) You are older today than yesterday.
(ii) A tossed coin will land heads up.
(iii) A die when tossed shall land up with 8 on top.
(iv) The next traffic light seen will be green.
(v) Tomorrow will be a cloudy day.
Ans:
(i) It is certain to happen.
(ii) It can happen but not certain.
(iii) It is impossible.
(iv) It can happen but not certain.
(v) It can happen but not certain.
Q2: There are 6 marbles in a box with numbers from 1 to 6 marked on each of them.
(i) What is the probability of drawing a marble with number 2?
(ii) What is the probability of drawing a marble with number 5?
Ans: Total marbles from 1 to 6 marked in a box = 6
(i) The probability of drawing a marble with number 2.
⇒ P (drawing one marble) = 1/6
(ii) The probability of drawing a marble with number 5.
⇒ P (drawing one marble) = 1/6
Q3: A coin is flipped to decide which team starts the game. What is the probability that your team will start?
Ans: A coin has two possible outcomes Head and Tail.
Probability of getting Head or Tail is equal.
∴ P (Starting game) = 1/2
|
77 videos|386 docs|39 tests
|
FAQs on NCERT Solutions for Class 7 Maths - Data Handling (Exercise 3.1 and 3.2)
| 1. What is the importance of data handling in statistics? |  |
| 2. What are the basic steps involved in data handling? | |
| 3. How can I represent data visually? | |
| 4. What types of data can be handled in statistics? | |
| 5. How do I calculate the mean, median, and mode of a dataset? | |


MCQs
,Objective type Questions
,video lectures
,Semester Notes
,NCERT Solutions for Class 7 Maths - Data Handling (Exercise 3.1 and 3.2)
,mock tests for examination
,Free
,Summary
,Sample Paper
,Important questions
,NCERT Solutions for Class 7 Maths - Data Handling (Exercise 3.1 and 3.2)
,ppt
,NCERT Solutions for Class 7 Maths - Data Handling (Exercise 3.1 and 3.2)
,Viva Questions
,study material
,practice quizzes
,shortcuts and tricks
,Extra Questions
,Exam
,Previous Year Questions with Solutions
,past year papers
;


NCERT Solutions: Data Handling Free PDF Download
Importance of NCERT Solutions: Data Handling
NCERT Solutions: Data Handling Notes
NCERT Solutions: Data Handling Class 7 Questions
Study NCERT Solutions: Data Handling on the App
|
© EduRev
|
Education Revolution
|


|


