Network Analysis: CPM | Construction Materials & Management - Civil Engineering (CE) PDF Download
Project Management
Project management is evolved to coordinate and control all project activities in an efficient and cost-effective manner.
The salient features of a project are:
- A project has identifiable beginning and endpoints.
- Each project can be broken down into many identifiable activities that will consume time and other resources during their completion.
- A project is scheduled to be completed by a target date.
- A project is usually large and complex and has many interrelated activities.
- The execution of the project activities is always subjected to some uncertainties and risks.
Network Techniques
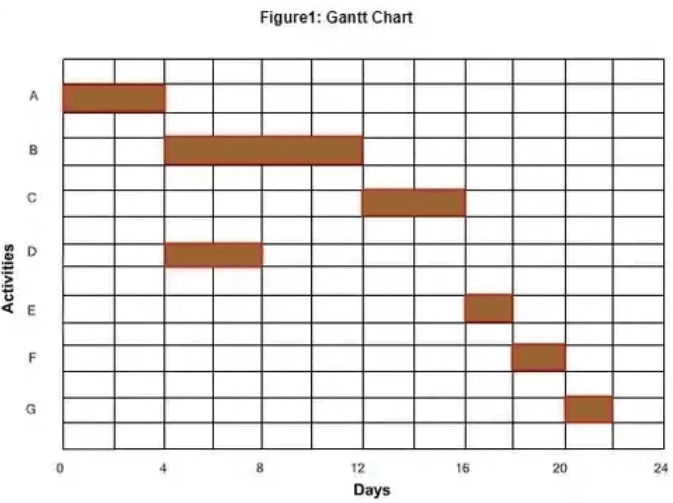
The predecessor to network techniques, the Gantt chart was developed, during world war I, by Henry L Gantt, for the purpose of production scheduling. An example of a Gantt chart is shown below.
The Gantt chart was later modified to a bar chart, which was an important tool in both the project and production schedule.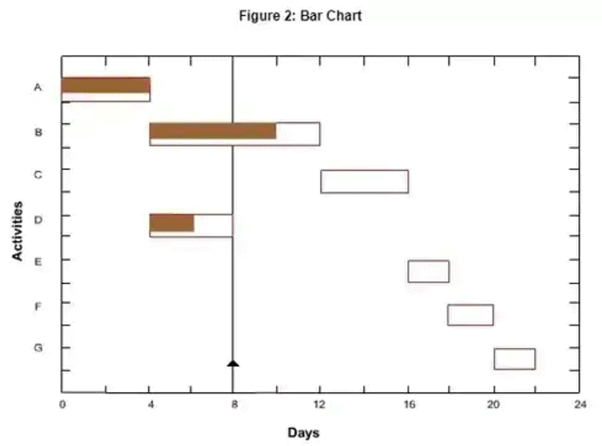
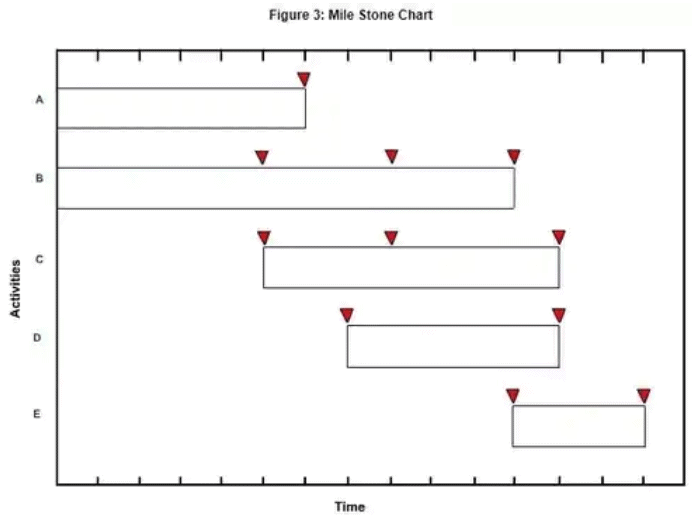
The bar charts then developed into milestone charts and next into network techniques (such as CPM and PERT). The bar chart didn't give information about critical activity and interdependence among activities. A bar chart is activity-oriented, while a milestone chart is event-oriented.
 |
Test: Crashing of Networks & Engineering Economy
|
Start Test |
Network Construction
A network is the graphical representation of the project activities arranged in a logical sequence and depicting all the inter-relationships among them. A network consists of activities and events.
- Activity
An activity is a physically identifiable part of a project, which consumes both time and resources. An arrow in a network diagram represents activity. The head of an arrow represents the start of the activity, and the tail of the arrow represents its end. The activity description and its estimated completion time are written along the arrow. Activity in the network can be represented in several ways: (i) by numbers of its head and tail events (i.e. 10-20 etc.), and (ii) by a letter code (i.e. A, B, etc.). All those activities, which must be completed before the start of the activity under consideration, are called its predecessor activities. All those activities, which have to follow the activity under consideration, are called its successor activities.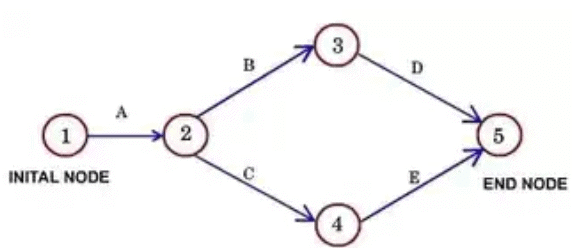
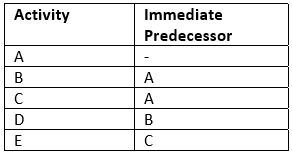
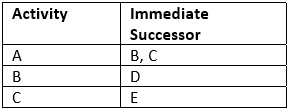
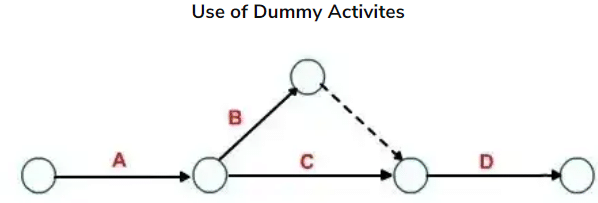
An activity used to maintain the pre-defined precedence relationship only during the construction of the project network is called a dummy activity. A dummy activity is represented by a dotted arrow and does not consume any time and resources. An unbroken chain of activities between any two events is called a path.
 - Event
An event represents the accomplishment of some task. In a network diagram, the beginning and end of an activity are represented as events. Each event is represented as a node in a network diagram. An event does not consume any time or resources. Each network diagram starts with an initial event and ends at a terminal event.
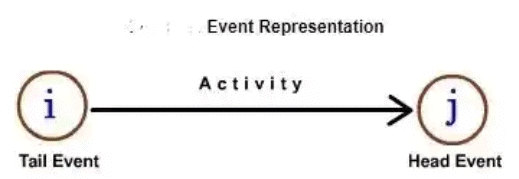
Each node is represented by a circle and numbered by using Fulkerson's Rule. The following steps are involved in the numbering of the nodes:
- The initial event, which has all outgoing arrows and no incoming arrow, is numbered 1.
- Delete all the arrows coming out from the node just numbered (i.e. 1). This step will create some more nodes (at least one) into initial events—number these events in ascending order (i.e. 2, 3 etc.).
- Continue the process until the final or terminal node, which has all arrows coming in, is numbered with no arrow going out.
An illustration of Fulkerson's Rule of numbering the events is shown in. As a recommendation, it must be noted that most of the projects are liable for modifications, and hence there should be scope for adding more events and numbering them without causing any inconsistency in the network. This is achieved by skipping the numbers (i.e. 10, 20, 30).
Rules for drawing a network diagram
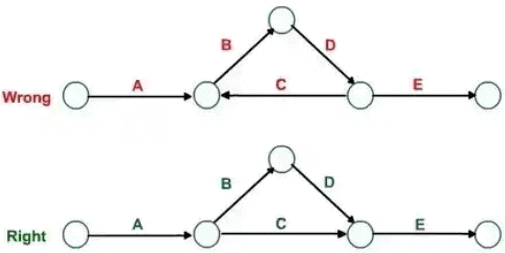
Rule 1: Each activity is represented by one and only one arrow in the network.
Rule 2: No two activities can be identified by the same end events.
Rule 3: Precedence relationships among all activities must always be maintained.
Rule 4: Dummy activities can be used to maintain precedence relationships only when actually required. Their use should be minimized in the network diagram.
Rule 5: Looping among the activities must be avoided.
Critical Path Method(CPM)
This is based on the deterministic approach in which only a one-time estimate is made for activity completion. The CPM (critical path method) system of networking is used when the activity time estimates are deterministic in nature. For each activity, a single value of time required for its execution is estimated. Time estimates can easily be converted into cost data in this technique. CPM is an activity-oriented technique.
- A network diagram in CPM is activity-oriented.
- Cost is the most important criteria. The minimum is found to correspond to the optimum time.
- There is only a single time estimate for each activity.
- The probability of completion of the activity in this estimated duration is 100%.
- It is based on a deterministic approach.
- Suitable for the repetitive type of work.
- The normal distribution is followed.
Activity times
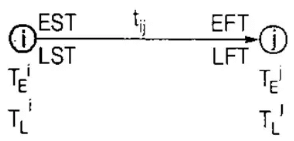
- Earliest start time

- Earliest start time
EFT = EST + Activity time
- Latest finish time
LFT = TL of head event
- Latest finish time
LST = LFT - tij
Float
Float denotes the range within which activity time or its finish time may fluctuate without
effecting the completion of the project.
- Total Float (FT)
FT = LST – EST or FT = LFT – EFT
- Free Total (FF)

Where Sj = Head event slack - Independent Float (FID)
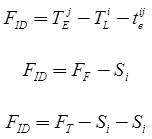
Where Si = Tail event slack
FT = 0 – for critical path FT > 0 –for subcritical path
FT < 0 – for Supercritical path - Interfering float (FIN)
It is another name for head event slack.
 |
Download the notes
Network Analysis: CPM
|
Download as PDF |
CPM Systems
Mainly two systems are used in CPM analysis:- A-O-A System (Activity on arrow system)
An activity is graphically represented by an arrow.
The tail end and the head end of the arrow represent the start and finish of the activity, respectively.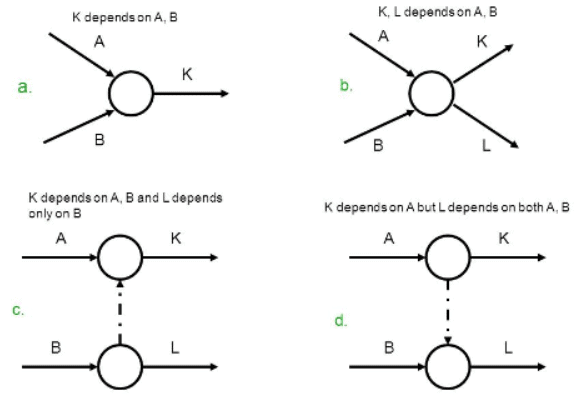 Activity on Arrow (AoA) Network Diagram
 - A-O-N System (Activity on node system or precedence diagram). Activity is represented by a circle or node. Events have no places. Arrows are used only to show the dependency relationship between activity nodes.
When two or more activities start parallel then an activity called DEBUT (D0) is provided at the beginning. Likewise, a finish activity (F0) is provided at the end when more than one activities finish parallel. Activity D & F have zero duration.
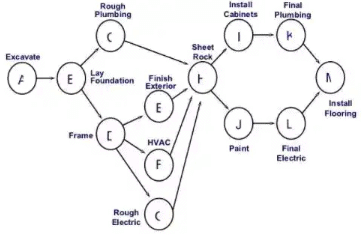 An Activity-On-Node (AON) Network
|
5 videos|21 docs|16 tests
|
FAQs on Network Analysis: CPM - Construction Materials & Management - Civil Engineering (CE)
| 1. What is CPM in Civil Engineering? |  |
| 2. How does CPM benefit civil engineering projects? |  |
| 3. What are the key components of a CPM network analysis in civil engineering? |  |
| 4. How is the critical path determined in CPM analysis? |  |
| 5. Can CPM be used for large-scale civil engineering projects? |  |


