Organisation of Data Class 11 Economics
| Table of contents |
|
| Introduction |
|
| Raw Data |
|
| Classification of Data |
|
| Variables: Continuous and Discrete |
|
| What is a Frequency Distribution? |
|
| Frequency Curve |
|
| Bivariate Frequency Distribution |
|

Introduction
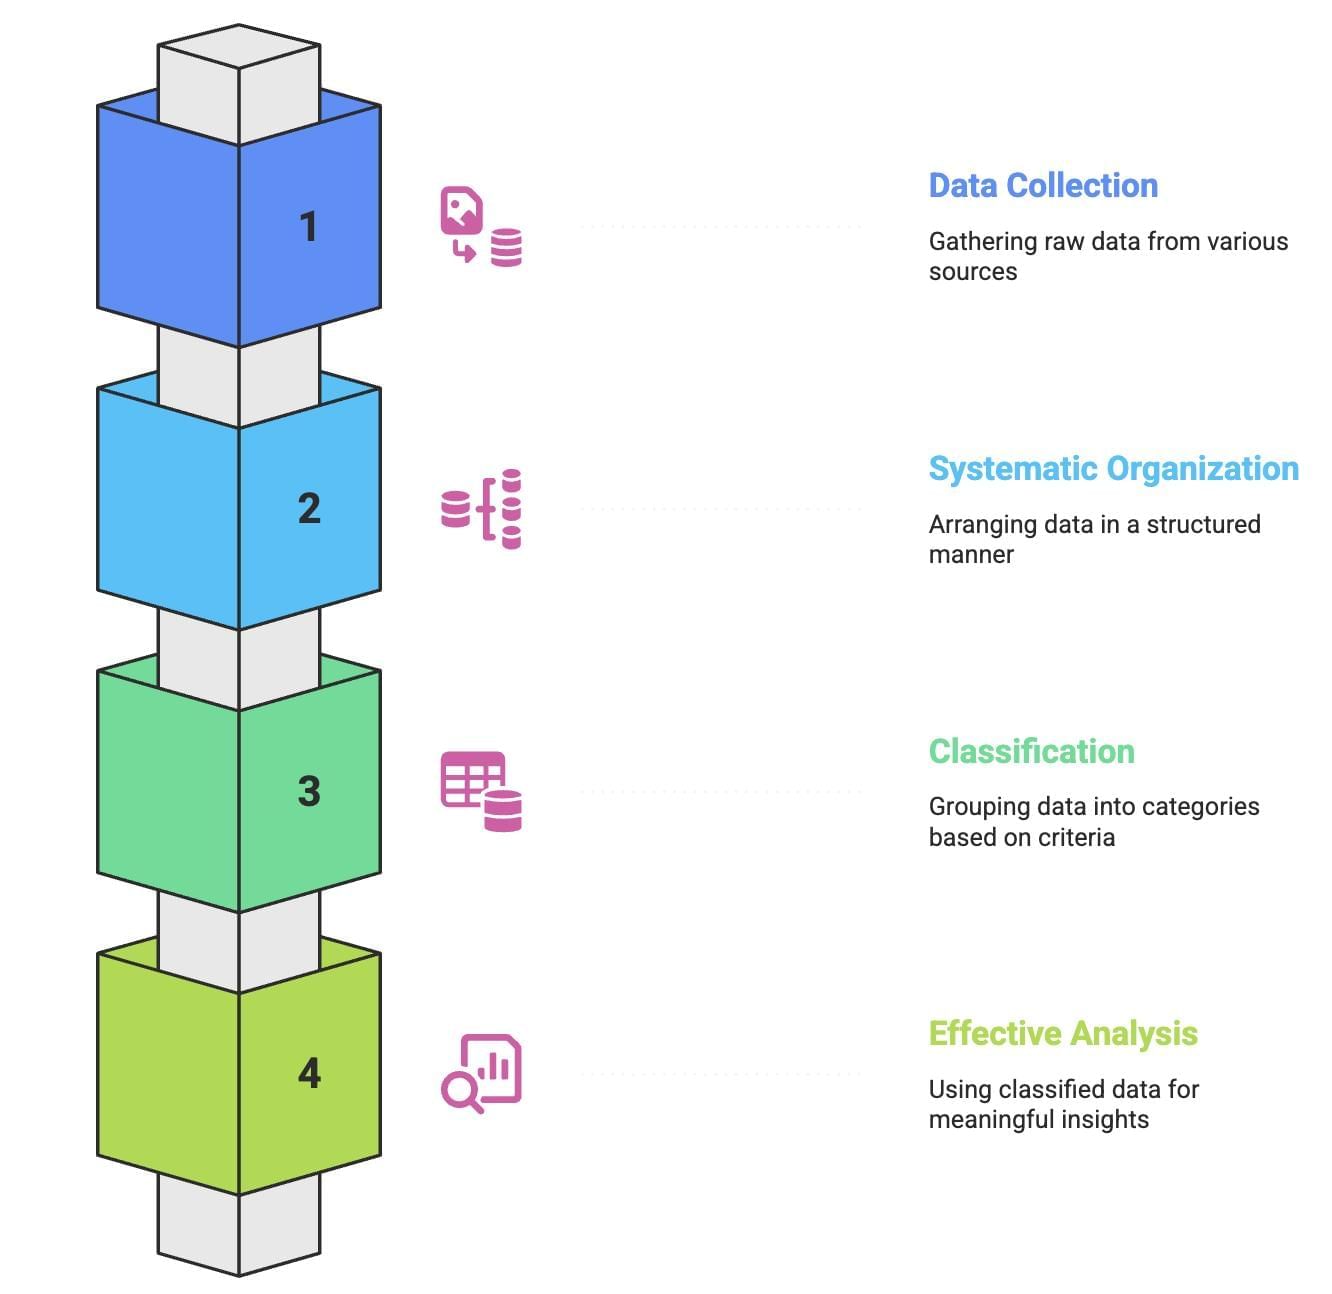
Once data is collected, it needs to be organised systematically so that it can be easily understood and analysed. This process is called classification — grouping data into categories based on specific criteria. Just like a junk dealer sorts items or a student organises books by subject, classification brings order, saves time, and makes retrieval simple. In this chapter, we explore how to organise raw data into meaningful groups for effective statistical analysis.
Raw Data
- Raw or unclassified data is messy, large, and hard to understand.
- It’s difficult to analyse or draw conclusions from such data because it's not organised.
- So, before doing any analysis, we need to arrange the data properly.
- For example, if a teacher has a list of math scores of 100 students, it’s hard to figure out how well the students performed just by looking at the list.
- To make sense of it, the teacher needs to organise the scores, like grouping them to see how many students scored above or below a certain mark.
- This process of organising data is called classification, which makes analysis much easier.
Classification of Data
- Data can be classified in different ways based on our needs.
- For example, instead of arranging your books by subjects like “History” or “Mathematics,” you could sort them by author names or year of publication.
- Similarly, raw data is classified based on its purpose.
- Let's understand the different classifications of data.
Chronological Classification
- This method organises data based on time, such as years, months, or weeks, arranged in either ascending or descending order.
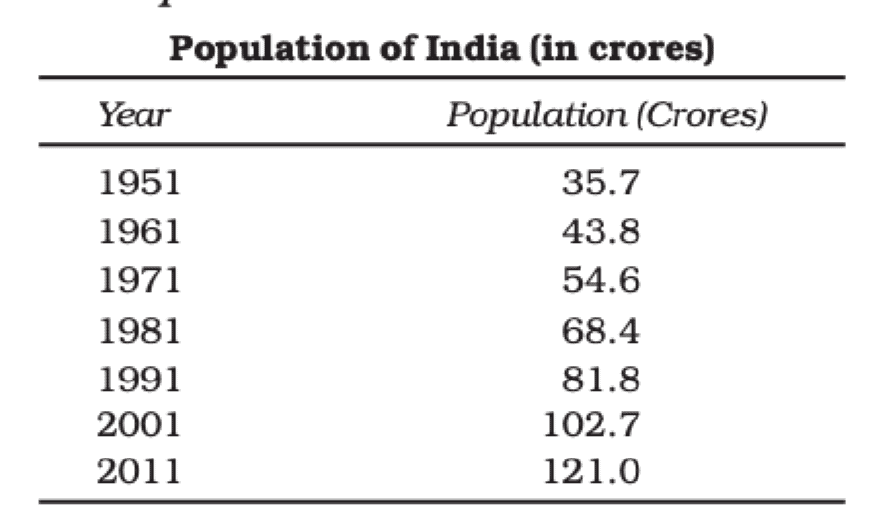
- For example, the population of India can be arranged by year.
- This type of data is known as a Time Series because it shows values across different time periods.
- This type of classification is also referred to as temporal classification.
 Chronological Classification
Spatial Classification
In this method, data is classified based on geographical locations such as countries, states, cities, or districts. For example, categorizing the population of different states in India.
 Spatial Classification
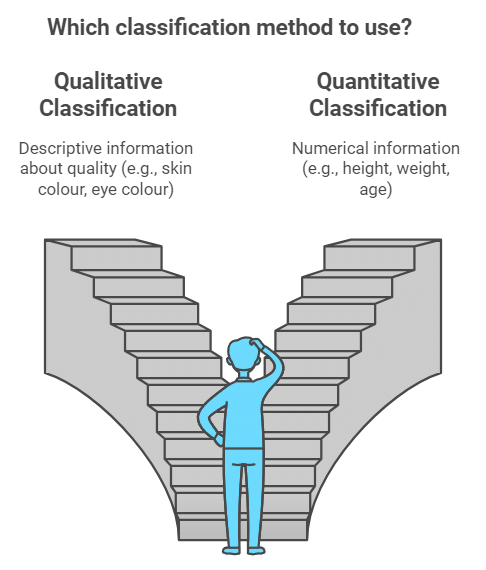
Qualitative Classification
This classification is used when data cannot be measured numerically but can be sorted based on qualities or attributes like nationality, literacy, gender, religion, etc. For example, classifying a population by gender (male, female) and then further by marital status (married, unmarried).
Quantitative Classification
This method is used for characteristics that can be measured numerically, such as height, weight, age, income, or marks. The data is grouped into classes to make analysis easier.
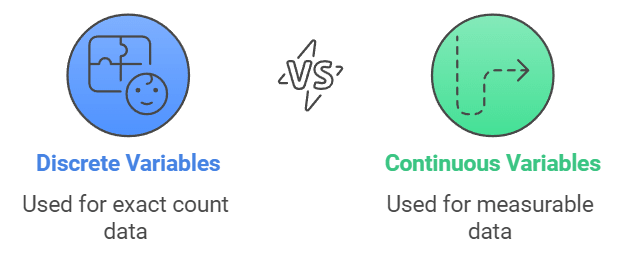
Variables: Continuous and Discrete
A variable is something that can change or vary and can be measured or counted. It’s like a container that holds different values depending on the situation. For example, your age, height, income, and even the number of chocolates in a box are all variables because their values can change.
Types of Variables
Variables are broadly classified into two types: Continuous Variables and Discrete Variables.
1. Continuous Variables
These variables can take any numerical value within a certain range. They can be whole numbers, fractions, or even decimals. Their values change smoothly without any jumps.
Examples:
- Height of a person: It could be 165 cm, 165.5 cm, or even 165.75 cm.
- Temperature: It could be 30°C, 30.1°C, or 30.15°C.
- Distance travelled: It could be 5 km, 5.25 km, or 5.333 km.
2. Discrete Variables
These variables can only take specific, separate values, usually whole numbers or certain fractions. They change in jumps or steps rather than smoothly.
Examples:
- Number of books on a shelf: It could be 10, 11, or 12 books—never 10.5 books.
- Number of students in a class: Always a whole number like 20, 21, or 22.
- Number of cars sold per day: You can sell 5 or 6 cars, but not 5.3 cars.
What is a Frequency Distribution?
A frequency distribution is a way of organizing and summarizing raw data to make it easier to understand. It helps us see how often different values appear in a dataset.
For example, if we have a list of marks scored by students in a math test, we can group these marks into classes like:
0–10, 10–20, 20–30, and so on. Then, we count how many marks fall into each class.
Let's understand important terms related to this concept:
Class Frequency
- The number of values that fall within a particular class.
- Example: If 7 students scored between 30 and 40 marks, the frequency for the class 30–40 is 7.
Class Limits
The two ends of a class.
- Lower Class Limit: The smallest value in a class (e.g., 30 in 30–40).
- Upper Class Limit: The largest value in a class (e.g., 40 in 30–40).
Class Interval or Class Width
- Discrete variables, on the other hand, are variables that can only take exact values and not fractional values.
- For example, the number of workers or students in a class is a discrete variable, as is the number of children in a family.
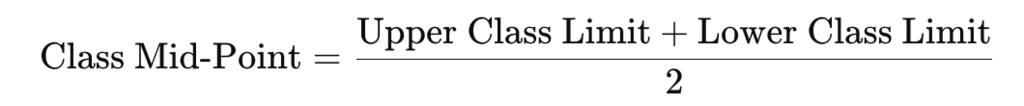
Class Mid Point or Class Mark
The class midpoint (or class mark) is the number in the middle of a class interval, found by adding the upper and lower limits and dividing them by two.

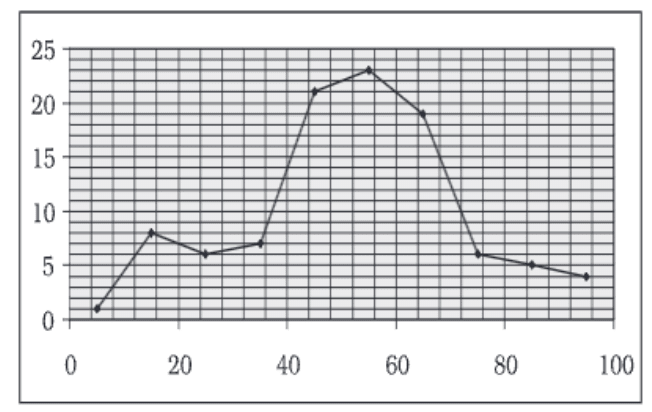
Frequency Curve
A Frequency Curve is a graphical representation of a frequency distribution. It shows how the frequencies of different classes are spread out over a range of values.
- The X-axis shows the class marks (middle values of each class).
- The Y-axis shows the frequencies (number of occurrences).
- By plotting the points and smoothly joining them, we get a Frequency Curve.
 Frequency Curve
Why Use Frequency Distribution?
Once we organize data into classes, we don't have to work with individual numbers anymore. Instead, we use the class marks to represent each class. It makes analyzing data much simpler and clearer.
How to Prepare a Frequency Distribution?
When making a frequency distribution, we need to think about these five important points:
Equal or Unequal Sized Class Intervals:
Should all classes be of the same size (e.g., 0-10, 10-20) or different sizes?Number of Classes:
How many classes should we make? This depends on the range of the data and how detailed we want the grouping to be.Size of Each Class:
What should be the width of each class? For example, should each class cover a range of 10 marks or 20 marks?Determining Class Limits:
Deciding the lower and upper limits of each class. For example, if we choose the class 20–30, then 20 is the lower limit and 30 is the upper limit.Calculating Frequencies:
Counting how many data points fall into each class.
Should We Have Equal or Unequal-Sized Class Intervals?
There are two situations where unequal class intervals are used:
1. Wide Range of Data:
- When the data has a very high range, like income per day ranging from almost zero to hundreds of crores.
- If we use equal-sized intervals, we either end up with too many classes or lose important details about very high or very low values.
2. Concentrated Data:
- When most of the data is concentrated in a small part of the range.
- Equal intervals would result in some classes having very few values, making the data representation unclear.
In all other cases, equal-sized intervals are used.
How Many Classes Should We Have?
- Usually, the number of classes is kept between six and fifteen.
- If we are using equal-sized intervals, we can calculate the number of classes by dividing the range (difference between the largest and smallest values) by the size of the intervals.
What Should Be the Size of Each Class?
- The size of each class depends on the range of the data and the number of classes.
- For example, if the range is 100 and we want 10 classes, the class interval would be 10 (100 ÷ 10).
- If we choose unequal intervals, the widths of the classes will vary.
How Should We Determine the Class Limits?
Class limits are the boundaries that define each class in a frequency distribution. They should be:
- Definite and clearly stated.
- Avoid open-ended classes like “70 and over” or “less than 10.”
- Frequencies should be concentrated in the middle of the class intervals.
Types of Class Intervals
1. Inclusive Class Intervals
- Both the lower and upper limits of a class are included in the frequency of that class.
- Example: In the interval 20–30, both 20 and 30 are included.
- This type is commonly used for discrete variables like the number of students in a class.
2. Exclusive Class Intervals
- The upper limit of a class is excluded from that class but included in the next class.
- Example: In the interval 20–30, 30 is not included; it belongs to the next interval 30–40.
- This type is commonly used for continuous variables like height, weight, and marks.
Example
Let's understand the difference between Inclusive and Exclusive Class Intervals using an example of marks scored by students in a test.
Inclusive Form of Class Intervals
Here, both the lower and upper limits are included.
Suitable for discrete variables where values are exact numbers (like marks without fractions).
Example (Marks ranging from 0 to 100 with 10 class intervals):
0 – 10 (Includes both 0 and 10)
11 – 20 (Includes both 11 and 20)
21 – 30 (Includes both 21 and 30)
...
91 – 100 (Includes both 91 and 100)
Exclusive Form of Class Intervals
- Here, the upper limit of a class is excluded and becomes the lower limit of the next class.
- Commonly used for continuous data.
- Example (Marks ranging from 0 to 100 with 10 class intervals):
0 – 10 (Includes 0 but not 10)
10 – 20 (Includes 10 but not 20)
20 – 30 (Includes 20 but not 30)
...
90 – 100 (Includes 90 but not 100)
Special Cases
In the exclusive method, we need to decide how to handle values that fall on the boundary (e.g., 10, 20, 30, etc.).
Case of Lower Limit Excluded: Values like 10 or 30 are included in the previous interval (0 to 10, 20 to 30).
Case of Upper Limit Excluded (Most Common): Values like 10 or 30 are included in the next interval (10 to 20, 30 to 40).
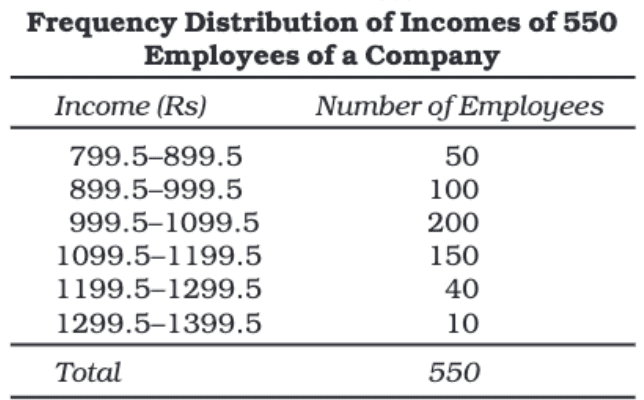
Adjustment in Class Interval
When using the Inclusive Method for continuous data, there is often a gap between class limits. For example, if the first class is 0–899 and the second class is 900–1799, there's a gap of 1 between 899 and 900. To ensure continuity, we need to adjust the class intervals as follows:
Steps to Adjust Class Intervals:
1. Find the Difference:
- Subtract the upper limit of the first class from the lower limit of the next class.
- Example: 900 (lower limit of second class) - 899 (upper limit of first class) = 1.
2. Divide the Difference by Two:
- 1 ÷ 2 = 0.5.
3. Adjust the Lower Limits:
- Subtract 0.5 from the lower limit of each class.
- Example: 0 becomes -0.5, 900 becomes 899.5, and so on.
4. Adjust the Upper Limits:
- Add 0.5 to the upper limit of each class.
- Example: 899 becomes 899.5, 1799 becomes 1799.5, and so on.
Adjusted Class Mark Formula:
After adjusting the class intervals, the formula to find the class mark becomes:

How to Get the Frequency for Each Class?
The frequency of an observation is just the number of times it appears in the data.
Tally Marking
Tally marking is a way to keep track of numbers using a simple counting method.
The usual way to represent tally marks is in groups of five lines:
- The first four lines are drawn vertically.
- The fifth line is drawn diagonally across the first four lines.
Tally marks were commonly used in the past for counting things, especially personal belongings.
For example, it was helpful for counting domestic animals like goats and cows, which could be hard to track.
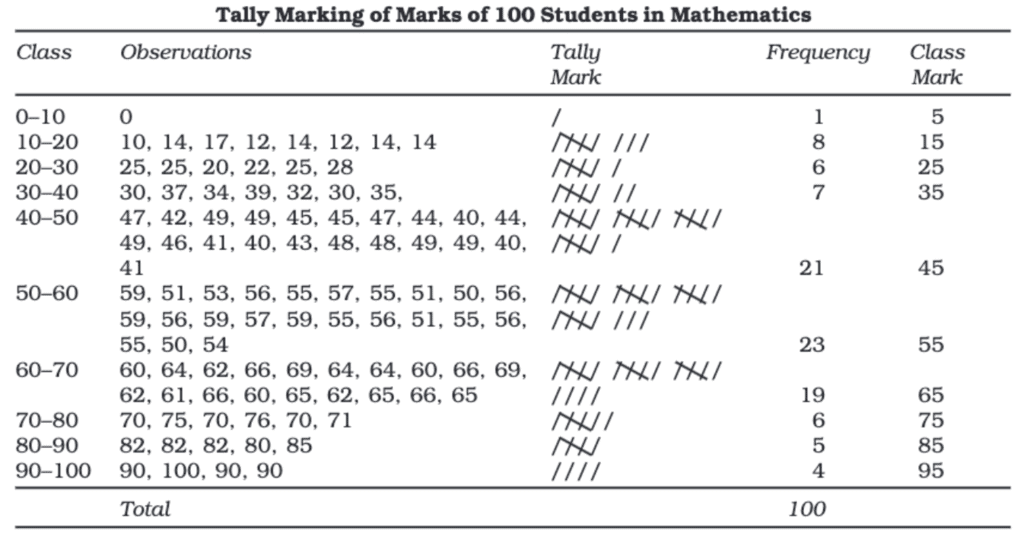
Example
Imagine you are a teacher with 100 students who just completed a math test. You want to see how the marks are spread out. The marks range from 0 to 100.
Steps to Find Frequency Using Tally Marks
Prepare the Class Intervals (Exclusive Form):
- 0 – 10, 10 – 20, 20 – 30, ... , 90 – 100
Marking the Tally:
- Go through the list of students' marks one by one.
- For each mark, draw a tally mark (
/) in the corresponding class interval. - When you reach 5 tallies, cross them like this:
////.
Count the Tallies:
- Group the tallies in sets of 5 to make counting easier.
- The number of tallies in each class is the frequency.
Loss of Information
When we organize data into a frequency distribution table, we simplify and summarize the raw data. However, this also causes a loss of detail.
Why is Information Lost?
- When we group data into classes, we only record how many observations fall into each class (frequency), not the actual values themselves.
- For example, if the class interval is 20–30, and the frequency is 6, we only know that 6 values lie within this range. But we don’t know what those exact values are.
Example
Let's say we have the following scores: 25, 25, 20, 22, 25, 28.
- If we group them into the class interval 20–30, the frequency becomes 6.
- We lose the individual values (25, 25, 20, 22, 25, 28) and only keep the number 6.
- When we do calculations, we assume all values in the class are equal to the class mark (the midpoint of the interval, which is 25 in this case).
Why is This Important?
- This loss of information is significant when we need to be precise with our calculations.
- However, the purpose of creating frequency tables is usually to make sense of large amounts of data, so the trade-off is often worth it.
Frequency Distribution with Unequal Classes
Sometimes, dividing data into equal class intervals may not effectively represent the data. In such cases, we use unequal class intervals to make the representation more meaningful.
Why Use Unequal Class Intervals?
1. Concentration of Data:
- When a large number of observations are concentrated within a few classes, those classes may need to be split into smaller intervals.
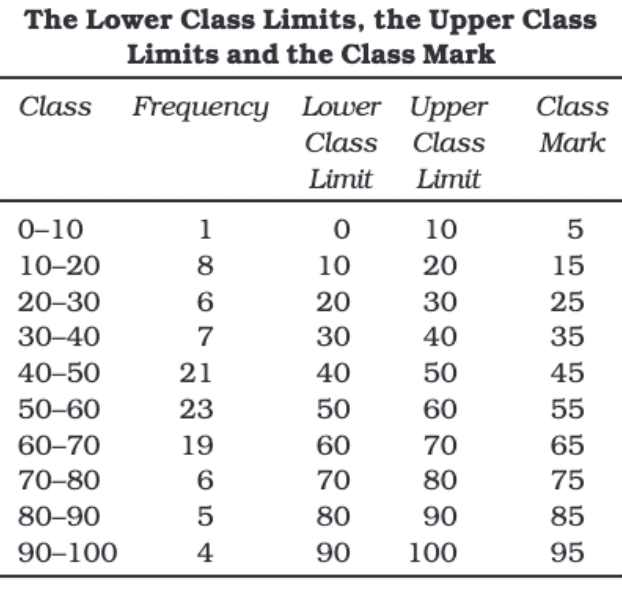
- Example: In Table 3.6, most of the data lies within 40–50, 50–60, and 60–70 with frequencies 21, 23, and 19 respectively.
- Together, these classes contain 63 out of 100 observations (63%).
2. Deviation from Class Marks:
- In such concentrated classes, observations are closer to the class mark (midpoint).
- In other sparsely populated classes, the observations deviate more from the class mark.
How to Create Unequal Classes:
- Split the crowded classes to make them more representative.
- Example: Instead of 40–50, 50–60, and 60–70, we use:
40–45 and 45–50 (instead of 40–50)
50–55 and 55–60 (instead of 50–60)
60–65 and 65–70 (instead of 60–70) - These new classes have a smaller interval of 5, while the remaining classes keep their old interval of 10.
Frequency Array
A Frequency Array is used to organize data related to discrete variables. Discrete variables are those that take specific, separate values and not intermediate fractional values between them.
Example of Frequency Array
The table shows the Size of Households and the corresponding Number of Households.
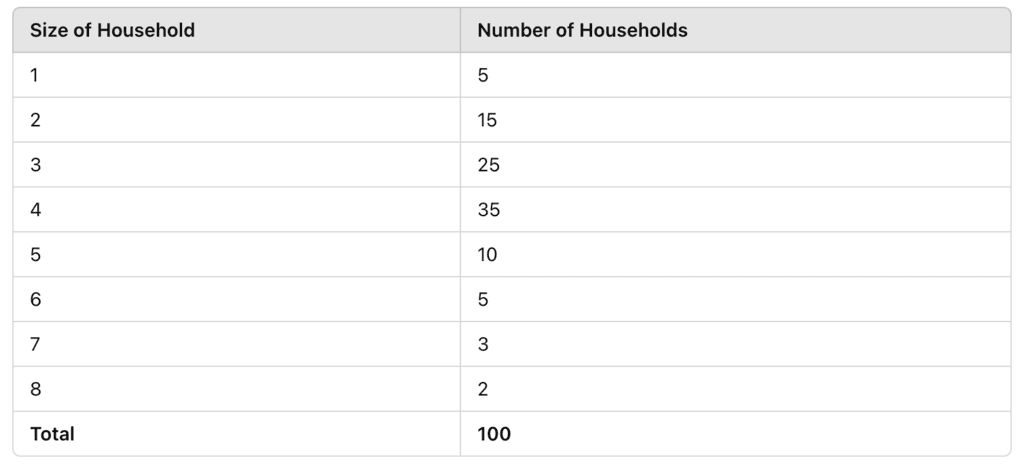
- The size of the household is a discrete variable because it can only take specific, whole numbers like 1, 2, 3, etc.
- The frequency of each size is recorded as the number of households with that size.
- Example: There are 35 households with a size of 4 members.
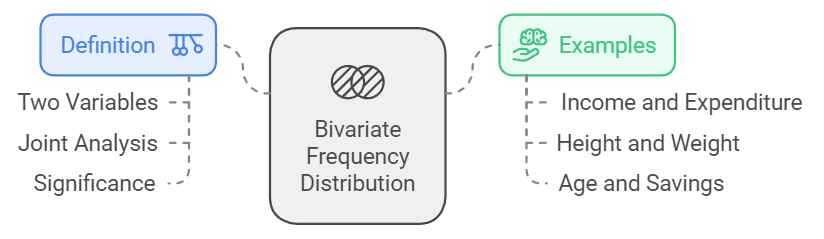
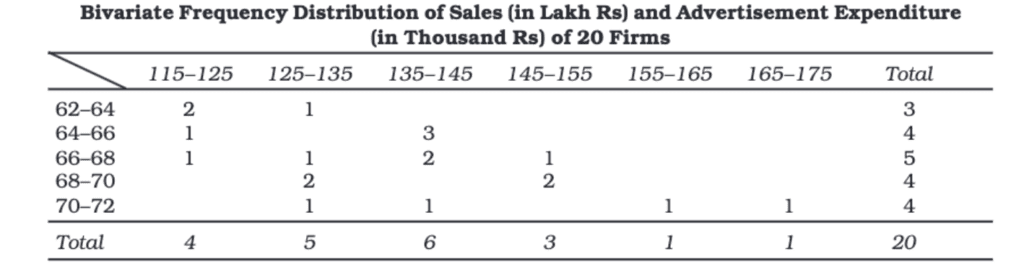
Bivariate Frequency Distribution
When the frequency distribution involves two variables, it is called a bivariate frequency distribution. This type of distribution shows the frequencies of two variables together, such as the income and expenditure data of households.
Univariate Frequency Distribution
A statistical data series that shows the frequency of only one variable is referred to as univariate frequency distribution. This type of frequency distribution displays the frequency distribution of a single variable, such as the income of people or marks scored by students.
Multivariate Distribution
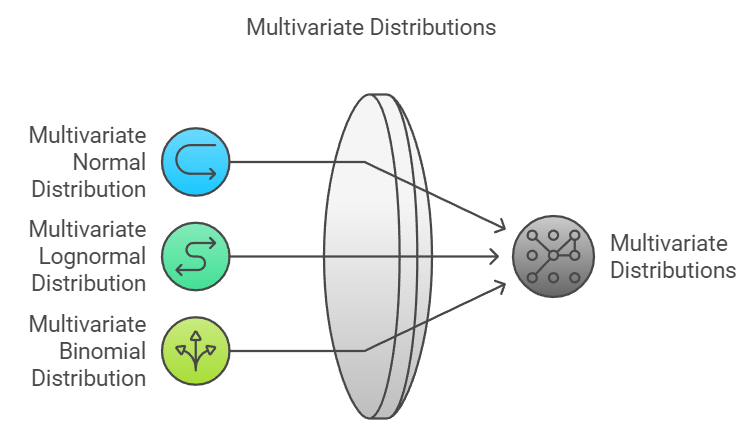
Multivariate distributions represent the correlation between at least two estimates and the relationships among them. For each univariate distribution with one random variable, there is a broader multivariate distribution. For example, the univariate normal distribution has a broader counterpart, the multivariate normal distribution, which is the most commonly used model for examining multivariate data. However, there are other types of multivariate distributions as well, including the multivariate lognormal distribution, the multivariate binomial distribution, etc.
|
193 videos|169 docs|152 tests
|
FAQs on Organisation of Data Class 11 Economics
| 1. What is raw data and how is it different from organized data? |  |
| 2. What are the different types of data classifications? | |
| 3. What are class limits and how do they relate to class intervals? | |
| 4. What is the significance of attributes in data classification? | |
| 5. How does chronological classification aid in data analysis? | |


Semester Notes
,MCQs
,shortcuts and tricks
,mock tests for examination
,Organisation of Data Class 11 Economics
,Viva Questions
,ppt
,Previous Year Questions with Solutions
,Important questions
,Extra Questions
,study material
,Organisation of Data Class 11 Economics
,Organisation of Data Class 11 Economics
,Exam
,video lectures
,past year papers
,Free
,Sample Paper
,Objective type Questions
,Summary
,practice quizzes
;


Chapter Notes - Organisation of Data Free PDF Download
Importance of Chapter Notes - Organisation of Data
Chapter Notes - Organisation of Data
Chapter Notes - Organisation of Data Mechanical Engineering Questions
Study Chapter Notes - Organisation of Data on the App
|
© EduRev
|
Education Revolution
|


|


