Short Notes: Unit 1: Law of Demand and Elasticity of Demand | Business Economics for CA Foundation PDF Download

To understand economics, we must first understand what demand means. Demand is not just about wanting something; it also means having the money and the willingness to buy it. For example, you may want a phone, but if you don’t have the money or don’t plan to buy it, it is not called demand in economics. So, demand means both the desire and the ability to buy a product at a given price, during a particular time. Demand plays an important role in deciding prices, how much goods are produced, and how businesses plan their work.
Meaning of Demand
Demand refers to more than just the desire for a product — it involves the actual intention and ability to purchase. In economics, demand is defined as the quantity of a good or service that consumers are willing and able to purchase at various price levels over a given period of time.
To constitute effective demand, three essential conditions must be met:
Desire to acquire the good or service,
Ability to pay (adequate purchasing power), and
Willingness to spend that purchasing power.
A mere wish to buy, without the financial means or readiness to act, does not qualify as demand in economic terms.
Key Characteristics of Demand:
It relates to a specific price and specific period (e.g., 500 units per week at ₹20 each).
Demand is a flow concept, meaning it is measured over time (e.g., per day, per month), not at a fixed point.

Determinants of Demand
1. Price of the Commodity: Inverse relationship with demand; as price rises, quantity demanded falls (ceteris paribus).
2. Price of Related Goods:
- Complementary Goods: Consumed together (e.g., tea and sugar). A price drop in one increases demand for the other.
- Substitute Goods: Replace each other (e.g., tea and coffee). Price rise in one increases demand for the substitute.
3. Disposable Income:
- Normal Goods: Demand rises with income.
- Inferior Goods: Demand falls as income rises beyond a point.
- Luxury Goods: Demand increases significantly at higher income levels.
4. Tastes and Preferences: Influenced by trends, demonstration effect (imitating others), bandwagon effect (following the crowd), snob effect (desiring exclusivity), and Veblen effect (demand for high-priced goods for status).
5. Consumer Expectations: Anticipation of future price rises or shortages increases current demand; expected price falls reduce it.
6. Other Factors: Population size, age distribution, national income, wealth distribution, credit availability, interest rates, government policies (taxes/subsidies), weather, and advertising.
The Demand Function
A symbolic representation of the relationship between quantity demanded (dependent variable) and its determinants (independent variables).
- Simple Form: Qx = f(Px, Py, I, T, E), where Qx is quantity demanded, Px is price, Py is price of related goods, I is income, T is tastes, and E is expectations.
- Linear Demand Function: Q = a - bP (where 'a' is the intercept, 'b' is the slope).
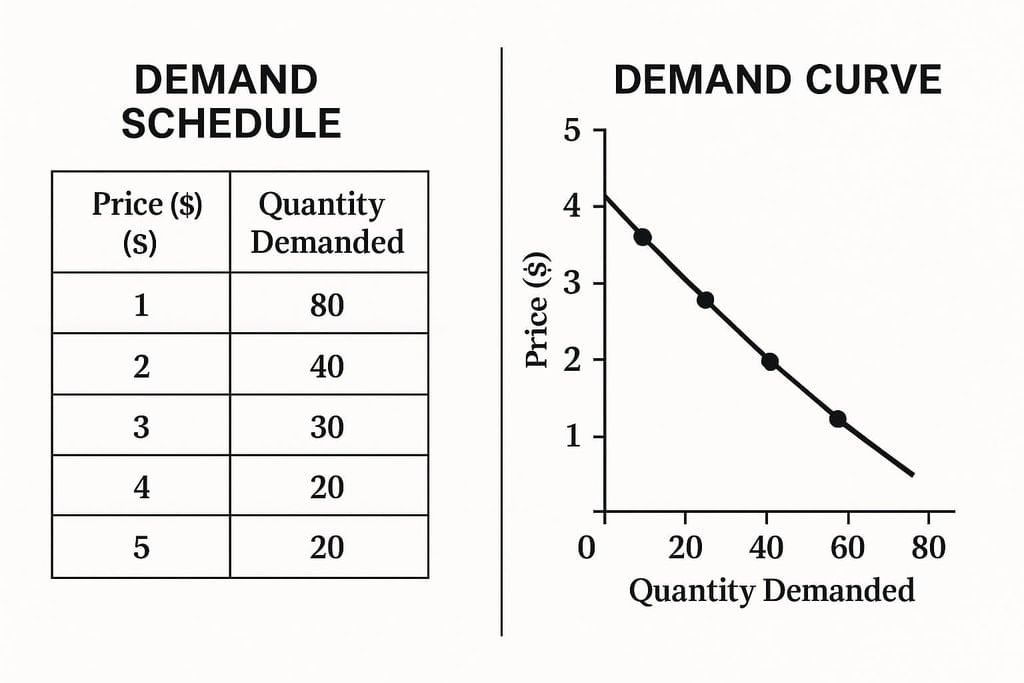
Demand Schedule and Curve
- Demand Schedule: A table showing quantities demanded at different prices (e.g., ice cream at ₹60, 0 units; at ₹0, 12 units).
- Demand Curve: A graphical representation of the demand schedule, with price on the vertical axis and quantity on the horizontal axis.
1. Slope: Downward (negative), reflecting the inverse price-quantity relationship.
2. Market Demand: Sum of individual demands at each price, also downward-sloping.
 Demand Schedule and Demand Curve
Law of Demand
Statement: All else being equal (ceteris paribus), when the price of a good falls, the quantity demanded rises. Conversely, when the price rises, the quantity demanded falls.
Why Does This Happen?
The law of demand holds true due to several natural consumer behaviors:
Substitution Effect: When a good becomes cheaper, people tend to switch to it from more expensive alternatives.
Income Effect: A lower price means consumers can afford more with the same income, making them feel richer and encouraging higher consumption.
Diminishing Marginal Utility: Each additional unit of a good gives slightly less satisfaction. So consumers buy more only if the price drops to match the lower utility.
New Buyers Enter the Market: Lower prices make the good affordable to more people, increasing total demand.
Wider Use Cases: At lower prices, a product might be used for more purposes than before, boosting its overall demand.

Exceptions to the Law of Demand
- Conspicuous Goods: Higher prices increase demand due to prestige (Veblen effect, e.g., diamonds).
- Giffen Goods: Inferior goods where demand rises with price due to budget constraints (e.g., staple foods like low-quality rice).
- Conspicuous Necessities: Demand remains stable despite price rises (e.g., TVs, refrigerators).
- Future Price Expectations: Anticipated price rises increase current demand.
- Incomplete Information/Irrational Behavior: Impulsive or uninformed purchases defy the law.
- Necessities: Demand for essentials remains constant regardless of price.
- Speculative Goods: Demand rises with price in speculative markets (e.g., stocks).
Expansion and Contraction of Demand
Expansion and contraction of demand refer to changes in the quantity demanded of a good or service due to changes in its price, while all other demand determinants (e.g., income, preferences, prices of related goods) remain constant. These changes result in movement along the same demand curve.- Expansion of Demand: Occurs when a decrease in price leads to an increase in quantity demanded. For example, if the price of apples drops from ₹100 per kg to ₹80 per kg, a consumer may increase purchases from 1 kg to 2 kg, assuming other factors like income and preferences remain unchanged.
- Contraction of Demand: Occurs when an increase in price leads to a decrease in quantity demanded. For instance, if the price of apples rises to ₹150 per kg, the consumer may reduce purchases to 0.5 kg.
- Movement Along the Demand Curve: Expansion is a downward movement (more quantity at a lower price), and contraction is an upward movement (less quantity at a higher price) on the same demand curve.
 Expansion and contraction of Demand
Increase and Decrease in Demand
An increase or decrease in demand refers to a shift of the entire demand curve due to changes in non-price determinants, resulting in a change in quantity demanded at the same price.Increase in Demand: A rightward shift of the demand curve, indicating more quantity demanded at each price. For example, a rise in consumer income may increase demand for normal goods like smartphones.
Decrease in Demand: A leftward shift of the demand curve, indicating less quantity demanded at each price, e.g., due to a change in consumer preferences away from a product.
Non-Price Determinants Causing Shifts:
- Rise in Income: Increases demand for normal goods (e.g., luxury cars).
- Increase in Wealth: Boosts demand for normal goods.
- Rise in Price of Substitutes: Increases demand for the good (e.g., if coffee price rises, tea demand may increase).
- Fall in Price of Complements: Increases demand (e.g., cheaper printers increase ink cartridge demand).
- Increase in Number of Buyers: Expands market demand.
- Favorable Change in Tastes: Shifts demand rightward (e.g., trend-driven demand for organic food).
- Income Redistribution: Favoring groups who prefer the commodity increases demand.
- Expectation of Future Price Rise: Encourages current demand.
- Government Policies: Subsidies or policies promoting consumption shift demand rightward.
Example:
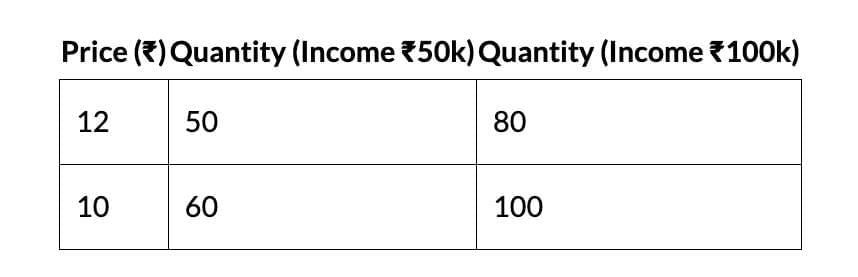
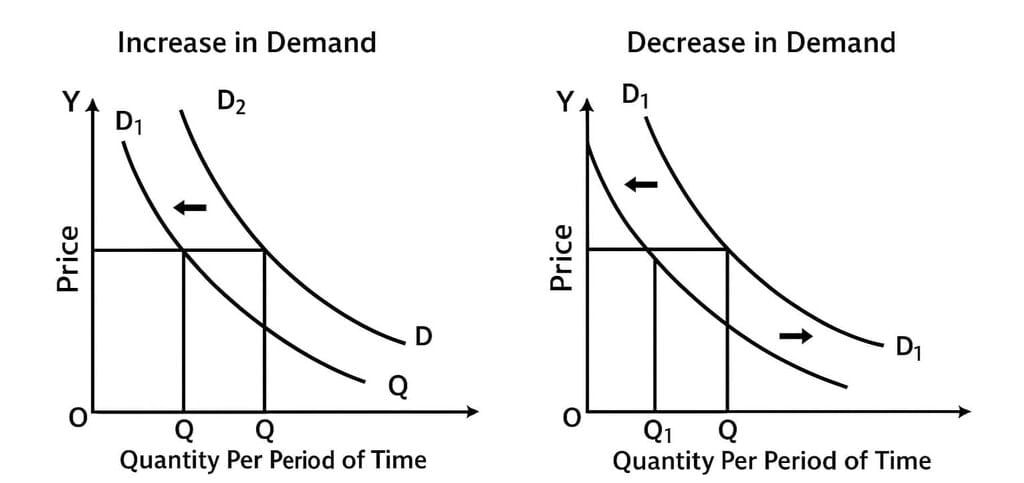 Figure a and b
Figure a: Rightward shift for increased demand
Figure b: Leftward shift for decreased demand.
Elasticity of Demand
Elasticity of demand measures how sensitive the quantity demanded is to changes in its determinants, such as price, income, or prices of related goods. It is expressed as the ratio of the percentage change in quantity demanded to the percentage change in a determinant.Types of Elasticity:
- Price Elasticity: Sensitivity to own price changes.
- Income Elasticity: Sensitivity to income changes.
- Cross Elasticity: Sensitivity to price changes of related goods.
- Advertisement Elasticity: Sensitivity to advertising efforts.
- Elasticity of Substitution: Sensitivity to switching between substitutes.
Importance: Helps firms predict sales impact of price changes, income shifts, or marketing efforts, and informs government tax policies.
(i) Price Elasticity of Demand (PED)
It shows how much the quantity demanded of a product changes when its own price changes.
1. Elastic: A small price change causes a big change in demand.
2. Inelastic: Even a big price change causes little change in demand.
3. Unitary: Price change and quantity change are proportionate.
Formula: 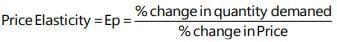
Examples:
- Headphones: Price drops from ₹5000 to ₹4000, demand rises from 100 to 150 units (Ep = 2.5, elastic).
- Wheat: Price drops from ₹20/kg to ₹18/kg, demand rises from 500 to 520 kg (Ep = 0.4, inelastic).
- Salt: Price drops from ₹9/kg to ₹7.5/kg, demand rises from 1000 to 1005 kg (Ep = 0.05, inelastic).
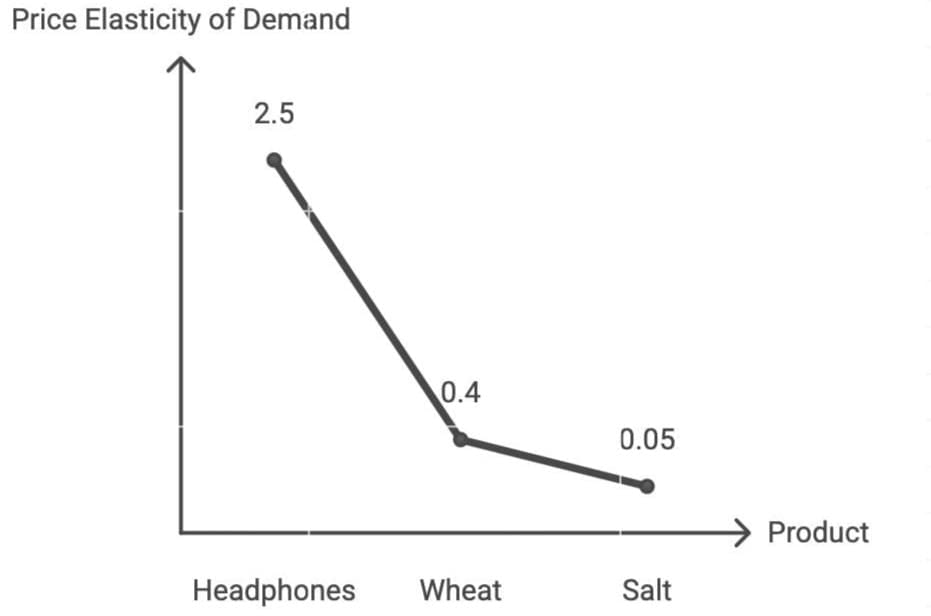 Price Elasticity of Demand for Different Goods
Measurement:
1. Point Elasticity: This measures elasticity at a specific point on the demand curve, using the geometric method. It's useful when there's a very small change in price.
 Geometric method: Given a straight line demand curve tT, point elasticity at any point say R can be found by using the formula

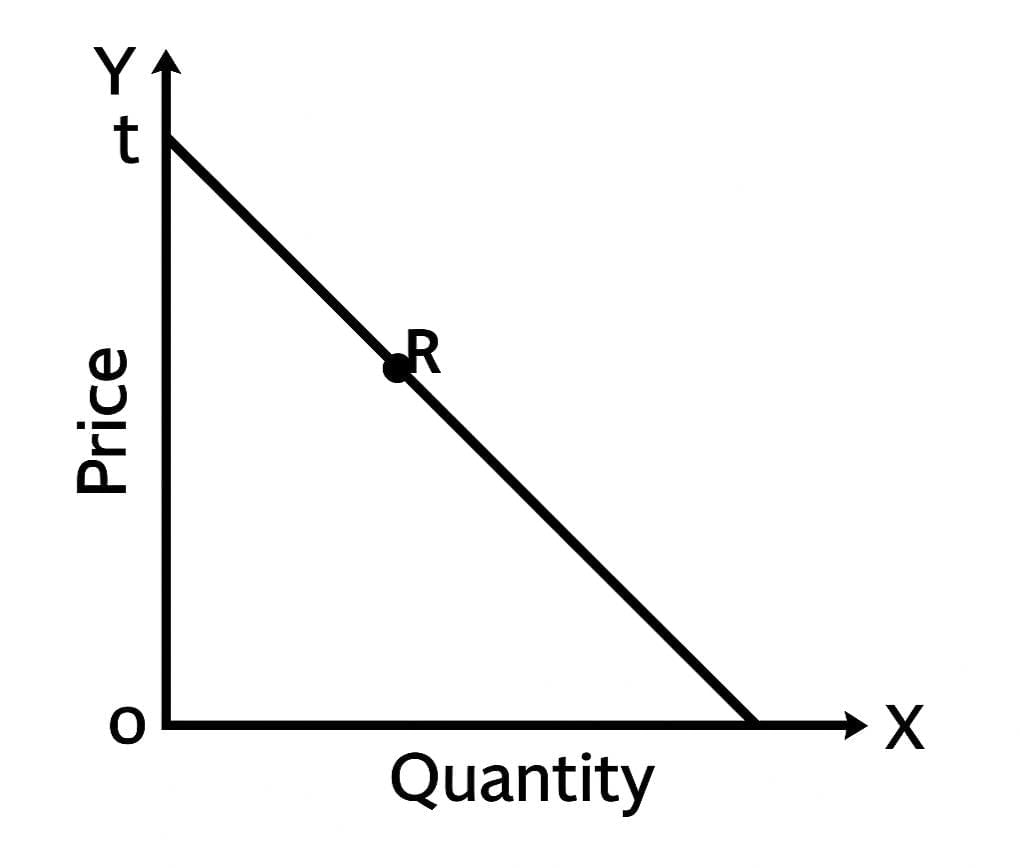 Point Elasticity
2. Arc Elasticity: This is used to calculate elasticity over a range of prices, especially when the price change is noticeable or large. 
 Arc Elasticity
Elasticity Ranges:
| Type of Elasticity | Value of Ep | Description | Curve Shape Example |
|---|---|---|---|
| Perfectly Inelastic | Ep = 0 | Quantity demanded doesn’t change at all with price (e.g., insulin). | Vertical line |
| Inelastic Demand | Ep < 1 | Quantity changes less than price (e.g., salt, wheat). | Steep downward slope |
| Unitary Elastic Demand | Ep = 1 | % change in quantity = % change in price. | Rectangular hyperbola |
| Elastic Demand | Ep > 1 | Quantity changes more than price (e.g., luxury items like headphones). | Flatter curve |
| Perfectly Elastic | Ep = ∞ | Even a tiny price change causes infinite change in quantity. | Horizontal line (perfect competition case) |
Total Revenue and Price Elasticity
- Total Revenue (TR): TR = Price × Quantity sold.
- Effects: Price effect (higher price increases revenue per unit); quantity effect (higher price reduces units sold).
- Impact:
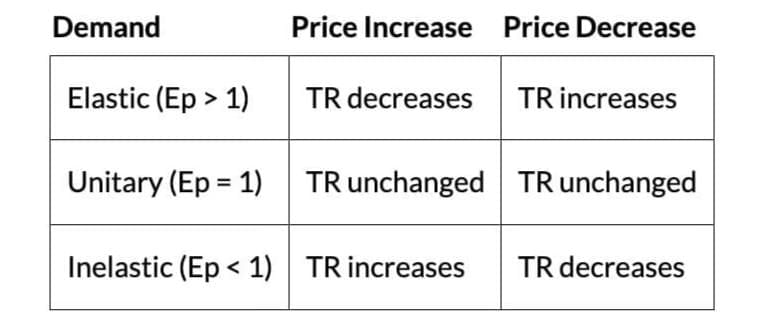
- Example: Wheat price falls from ₹20/kg to ₹18/kg, demand rises from 500 to 520 kg, TR drops from ₹10,000 to ₹9,360 (inelastic).
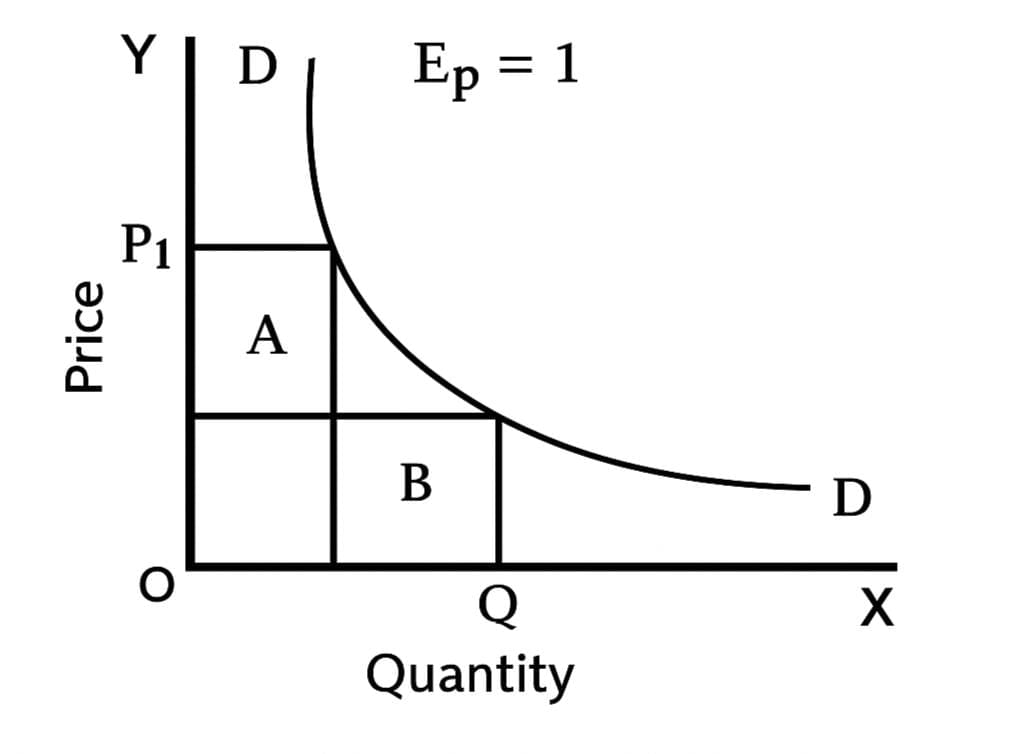 Total Revenue when Elasticity equals 1
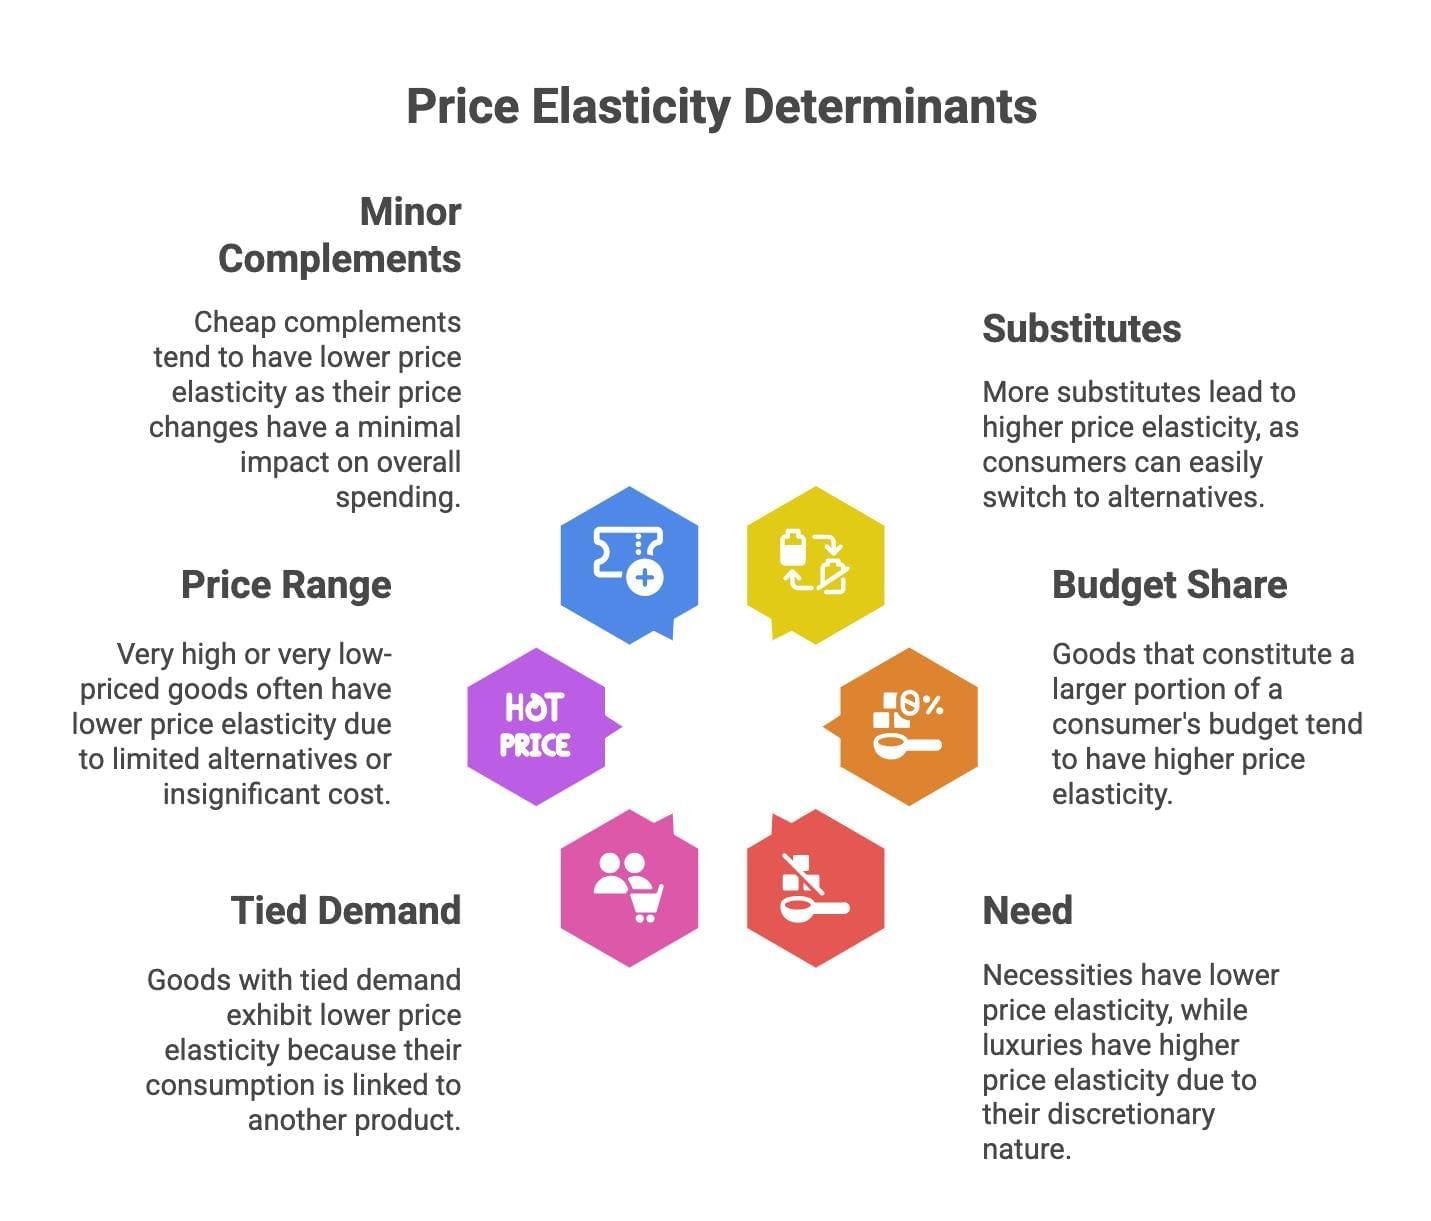
Determinants of Price Elasticity
- Substitutes: More substitutes increase elasticity (e.g., tea vs. coffee).
- Budget Share: Goods with larger budget shares (e.g., cars) are more elastic.
- Need: Necessities (e.g., food) are inelastic; luxuries (e.g., jewelry) are elastic.
- Tied Demand: Goods tied to others (e.g., printer ink) are inelastic.
- Price Range: High/low-priced goods (e.g., diamonds, matches) are inelastic.
- Minor Complements: Cheap complements (e.g., shoelaces) are inelastic.
Importance of Price Elasticity
- Firms: Set prices to maximize revenue (lower for elastic goods, higher for inelastic); use advertising to reduce elasticity.
- Government: Tax inelastic goods (e.g., tobacco) to ensure stable revenue.
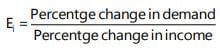
(ii) Income Elasticity of Demand
Measures how quantity demanded responds to changes in consumer income.- Formula:
- Types:
- Unitary (Ei = 1): Spending proportion stays constant.
- Elastic (Ei > 1): Spending proportion rises (luxuries).
- Inelastic (Ei < 1): Spending proportion falls (necessities).
- Negative (Ei < 0): Demand falls as income rises (inferior goods).
- Example: Income rises from ₹100 to ₹200, good at ₹40/unit:
- Unitary: Spending rises from ₹40 to ₹80 (Ei = 1).
- Elastic: Spending rises to ₹120 (Ei = 2).
- Inelastic: Spending rises to ₹60 (Ei = 0.5).
- Illustration: Income rises 7%, demand rises 7%, Ei = 1. Buttons demand unchanged, Ei = 0.
(iii) Cross Price Elasticity of Demand
Measures how the quantity demanded of one good responds to a price change in another related good, with other factors constant.- Formula: Ec = (% change in quantity demanded of good X) / (% change in price of good Y).
- Types:
1. Substitutes: Positive Ec; price increase in one good increases demand for its substitute.
2. Complements: Negative Ec; price increase in one good decreases demand for its complement.
3. Unrelated Goods: Ec ≈ 0; price change in one good does not affect the other. - Importance: Helps firms set pricing strategies, especially for substitutes (Ec > 1 risks customer loss) and complements (manage price impacts).
Substitute Goods and Demand
Goods that can replace each other; a price increase in one increases demand for the other.
- Cross-Demand Curve: Positively sloped; e.g., higher coffee prices increase tea demand, assuming tea’s price is constant.
- Example: Coffee price rises, consumers switch to tea, increasing tea demand.
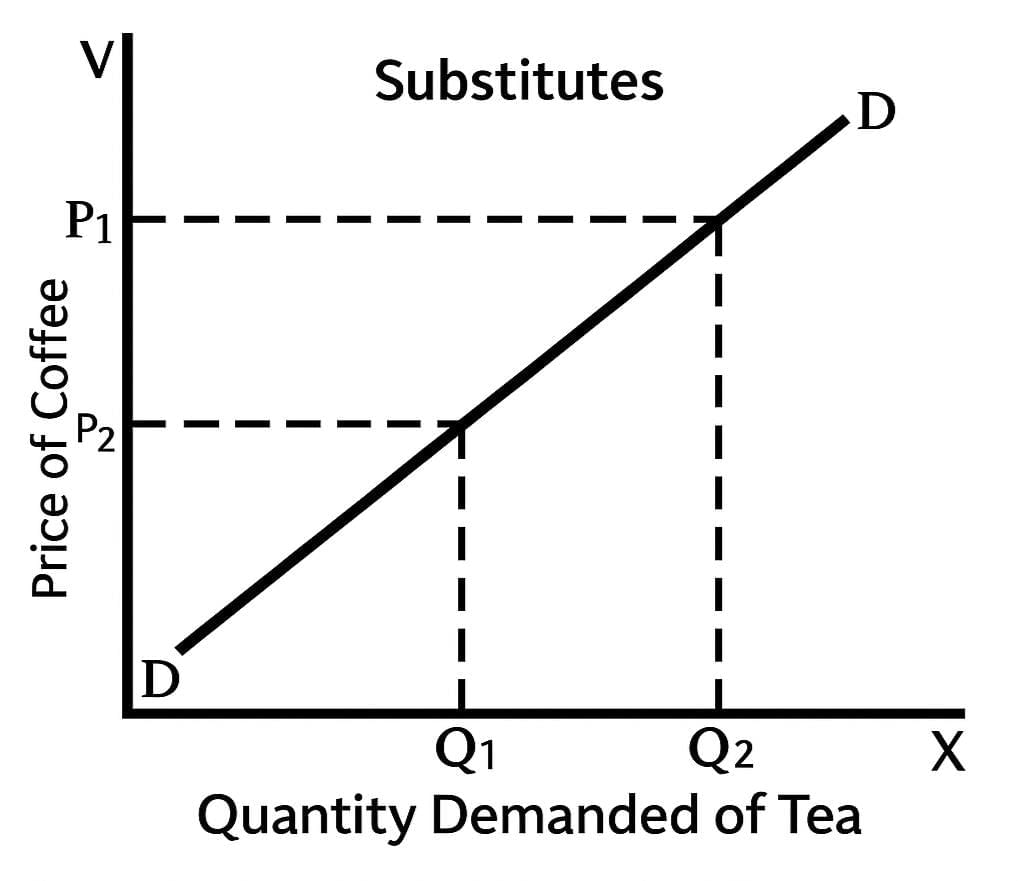 Positively sloped cross-demand curve showing tea demand (X-axis) increasing as coffee price (Y-axis) rises.
Complementary Goods and Demand
Goods consumed together; a price increase in one reduces demand for the other.
- Cross-Demand Curve: Negatively sloped; e.g., higher solar panel prices reduce battery demand.
- Magnitude: Slightly negative Ec indicates weak complements; highly negative Ec indicates strong complements.
- Note: Negative Ec may also result from strong income effects, not always complementarity.
- Examples: Bread and butter, cars and petrol, electricity and appliances.
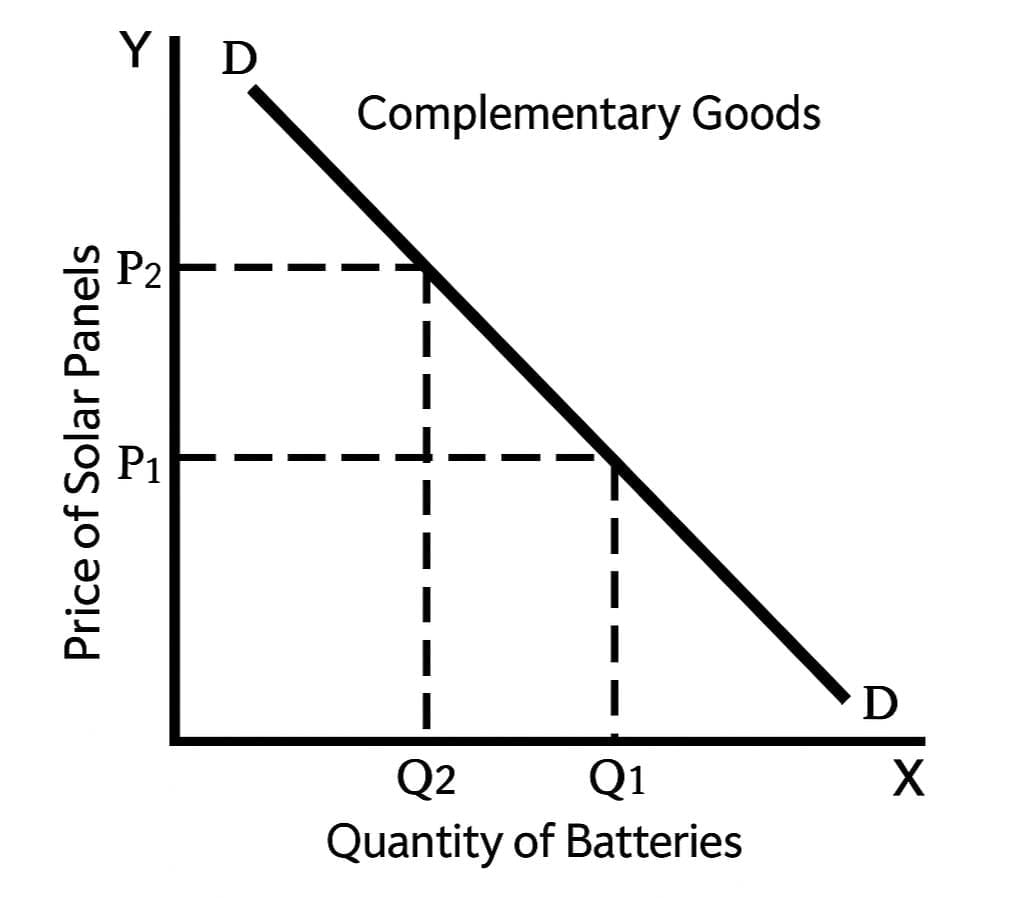 Negatively sloped cross-demand curve showing battery demand (X-axis) decreasing as solar panel price (Y-axis) rises.
(iv)Advertisement Elasticity of Demand
Measures how demand for a product responds to changes in advertising expenditure, quantifying the effectiveness of ad campaigns.- Formula:
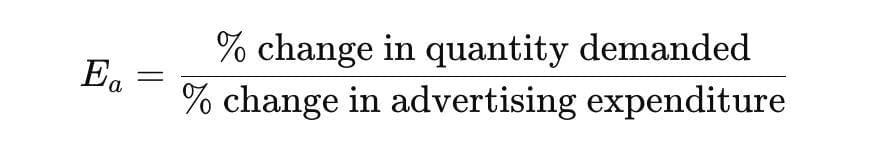
- Range: Positive, varies from 0 to infinity; higher Ea indicates stronger demand responsiveness to advertising.
- Interpretation:
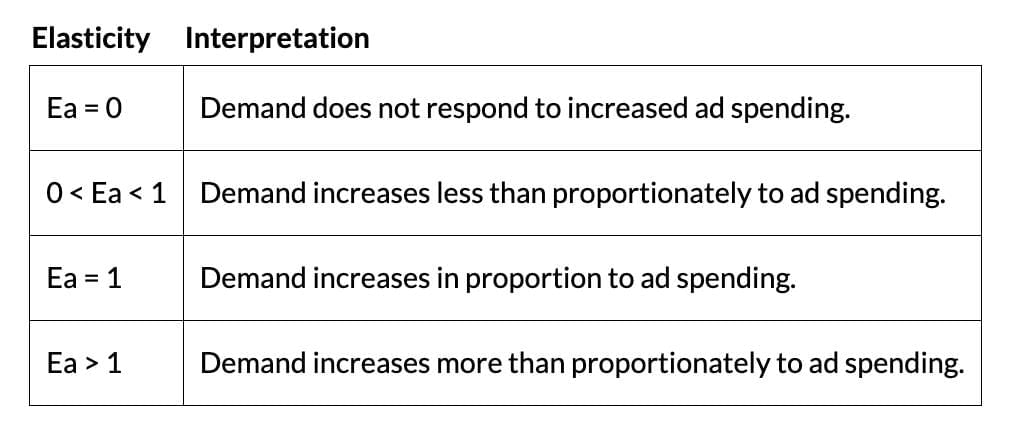
- Importance: Helps firms evaluate ad campaign effectiveness and determine optimal ad expenditure levels.
|
86 videos|200 docs|58 tests
|
FAQs on Short Notes: Unit 1: Law of Demand and Elasticity of Demand - Business Economics for CA Foundation
| 1. What is the meaning of demand in economics? |  |
| 2. What are the determinants of demand? | |
| 3. What is the law of demand? | |
| 4. What is the difference between an increase in demand and an expansion of demand? | |
| 5. What is price elasticity of demand (PED)? | |


past year papers
,practice quizzes
,Important questions
,Summary
,study material
,Extra Questions
,Semester Notes
,mock tests for examination
,Objective type Questions
,Free
,Viva Questions
,shortcuts and tricks
,Short Notes: Unit 1: Law of Demand and Elasticity of Demand | Business Economics for CA Foundation
,Previous Year Questions with Solutions
,Sample Paper
,Short Notes: Unit 1: Law of Demand and Elasticity of Demand | Business Economics for CA Foundation
,Short Notes: Unit 1: Law of Demand and Elasticity of Demand | Business Economics for CA Foundation
,MCQs
,video lectures
,Exam
,ppt
;


Short Notes: Unit 1: Law of Demand and Elasticity of Demand Free PDF Download
Importance of Short Notes: Unit 1: Law of Demand and Elasticity of Demand
Short Notes: Unit 1: Law of Demand and Elasticity of Demand
Short Notes: Unit 1: Law of Demand and Elasticity of Demand CA Foundation Questions
Study Short Notes: Unit 1: Law of Demand and Elasticity of Demand on the App
|
© EduRev
|
Education Revolution
|


|


within 7 days!