Stability Analysis & Phase Diagram | Mechanics & General Properties of Matter - Physics PDF Download
Energy Diagrams
We can often find the most interesting features of the motion of a one dimensional system by using an energy diagram, in which the total energy E and the potential energy U are plotted as functions of position. The kinetic energy K = E - U is easily found by inspection. Since kinetic energy can never be negative, the motion of the system is constrained to regions where U ≤ E .
Energy Diagram of Bounded Motion

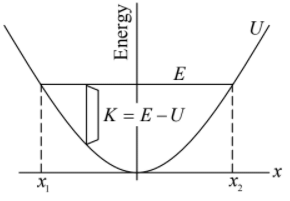
Here is the energy diagram for a harmonic oscillator. The potential energy U kx2/ 2 is a
parabola centered at the origin. Since the total energy is constant for a conservative system, E is represented by a horizontal straight line. Motion is limited to the shaded region where E ≥ U ; the limits of the motion, x1 and x2 in the sketch, are sometimes called the turning points.
Here is what the diagram tells us. The kinetic energy, K = E - U is greatest at the origin. As the particle flies past the origin in either direction, it is slowed by the spring and comes to a complete rest at one of the turning points x1 x2. The particle then moves toward the origin with increasing kinetic energy and the cycle is repeated.
The harmonic oscillator provides a good example of bounded motion. As E increases, the
turning points move farther and farther off, but the particle can never move away freely. If E decreased, the amplitude of motion decreases, until finally for E = 0 the particle lies at rest at x = 0.
Energy Diagram of Unbounded Motion
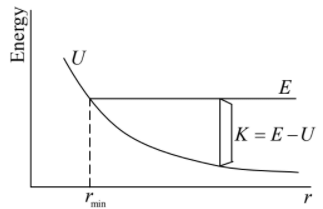
The pot U = A/r, where A is positive. There is a distance of closest approach rmin, as shown in the diagram, but the motion is not bounded for large r since U decreases with distance. If the particle is shot toward the origin, it gradually losses kinetic energy until it comes momentarily to rest at rmin. The motion then reverses and the particle moves back towards infinity. The final and initial speeds at any point are identical; the collision merely reverses the velocity. For positive energy, E > 0 , the motion is unbounded, and the atoms are free to fly apart. As the diagram indicates, the distance of closest approach, rmin, does not change appreciably as E is increased. The kinetic energy will be zero at rmin and as r increases the potential energy decreases, but kinetic energy K = E - U will increase sharply.
Example 1:
In the above figure, potential energy in different regions are given, where
The potential is assumed to be zero in all other regions.
(a) What will be kinetic energy in all region if total energy E is 10J ?
If ‘T ’ is kinetic energy and ‘V ’ is potential energy, then total energy E = T + V, so kinetic energy is T = E - V.
For total energy E = E1 all regions are classical allowed region.
So, in region x < a , V(x) = 0, so T = 10 - 0 = 10J
In region a < x < b , V (x) = V1 - 8J so T = 10 - 8 = 2J
In region b < x < c , V(x) = V2 = 3J so T = 10 - 3 = 7J
In region c < x < d , V(x) = V3 = 6J so T = 10 - 6 = 4J
In region d < x < e , V(x) = V4 = - 4 so T = 10 - (- 4) = 14J
In region e < x , K(x) = 0 so T = 10 - 0 = 10J
(b) What will be kinetic energy in all regions, if total energy E is 5 J ?
If T is kinetic energy and V is potential energy then total energy E = T + V , so kinetic energy is T = E - V
So, in region x < a , V(x) = 0 so, T = 5 - 0 = 5J
In region a < x < b , V(x) = V1 = 8J hence V1 > E2 so, T = 0 (classical forbidden region)
In region b < x < c , V(x) = V2 = 3J so, T = 5 - 3 = 2J
In region c < x < d , V(x) = V3 = 6J ⇒ V3 > E2 so, T = 0 (classical forbidden region)
In region d < x < e, V(x) = V4 = - 4 so, T = 5 - (-4) = 9J
In region e < x , V(x) = 0 so, T = 5 - 0 = 5J
Stability and Instability in One Dimension
Equilibrium Point: Any potential can be function of generalized coordinate, generalized velocity and time V ≡ V(x,x,t). The equilibrium point is defined where total external force on the system is zero i.e. for any co-ordinate say x is said to be equilibrium point if ∂V/∂x = 0 at x = x
Unstable Equilibrium Point: If x0 is maxima or (local maxima) i.e.  , then it is
said to be unstable equilibrium point. Unstable equilibrium point always behaves like repulsive point.
Stable Equilibrium Point: If x0 is minima or (local minima) i.e.  then it is said to be stable equilibrium point. Stable equilibrium point always behaves as an attractive point.
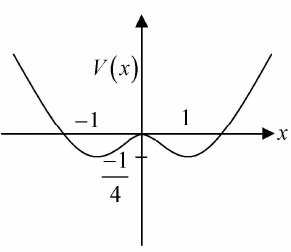
Example 2: If potential in one dimension is given by V(x) = x2/2 + x4/4 then
(a) Find the point where potential is zero
(b) Find the equilibrium point.
(c) Find the stable and unstable equilibrium point
(d) Draw phase curve i.e. V(x) vs x for given energy
(a) V(x) = 0 = ⇒ - x2/2 + x4/4 = 0 ⇒ x = 0, +√2, - √2
(b) For equilibrium point ∂V/∂x = 0 ⇒ - x + x3 = 0 . S o there are three equilibrium points. x1 = 0 , x2 = 1, x3, = -1
(c) For discussion of stability and instability, we must find, ∂2V/∂x2 = - 1 + 3x2. For stable ∂2V/∂x2 > 0. At x2 = 1 and x3 = - 1 the value of ∂2V/∂x2 = 2 which is greater than 0. Forunstable equilibrium point. ∂2V/∂x2 < 0. At x1 = 0, the value ∂2V/∂x2 = -1, which is less than 0 , so it is unstable point.
(d) V(x) vs x
 |
Download the notes
Stability Analysis & Phase Diagram
|
Download as PDF |
Small Oscillations
Let us assume the potential V(x) has stable equilibrium point at x = x0 then  0 and
0 and 
The Taylor expansion of V(x) about x = x0 is given by
If term (x - x0)2 is small then higher order term s can be neglected, then potential energy is equivalent to V(x) = V(x0) + (x - x0)2 because
So, force is equal to F = - ∂V/∂x, F =  .Hence, F ∝ - (x - x0) and the motion is small oscillation and the angular frequency is given by ω =
  , where m is mass of the particle. The term k =
  is identified as spring constant.
Example 3: If particle of mass m interact with potential ax2+ b/x2, then what will be the frequency of oscillation? (Assume oscillation is small)?
v(x) = ax2 + b/x2
For equilibrium point ∂V/∂x = 0
2ax - 2b/x3 = 0 ⇒ ax4 - b = 0 ⇒ x0 = ±(b/a)1/4Now, put the value of x0 = ±(b/a)1/4
k = 2a + (6b x α)/b = 8α ⇒ ω =
Phase Portrait
Phase Curve
The curve between position and its conjugate momentum for a given value of energy is known as phase space (curve).
A phase space of a dynamical system is a space in which all possible states of a system are represented, with each possible state corresponding to one unique point in the phase space. For mechanical system, the phase space usually consists of all possible values of position and momentum variables.
Separatix: The part of phase curve that corresponds to energy E which separates (hence the name) the phase space into two distinct areas.
Sign Convention of momentum: When particle is coming from negative x to positive x the momentum has positive sign and when particle is coming from positive x to negative x the momentum has negative sign.
Turning points: The value of x where Total energy E is equal to Potential energy V. At turning points the kinetic energy will be zero so momentum Px will become zero.
Properties of phase curve
- For given values of energy Phase curve will be unique.
- The phase curve will never intersect.
- The phase curve can be bounded as well as unbounded.
The phase portrait is a geometrical representation of trajectories of dynamical system in phase plane which is defined by generalized coordinate and its conjugate generalized momentum. The phase trajectory about unstable equilibrium point is mainly unbounded but phase trajectory about stable point is bounded and motion is defined as small oscillation.
How to draw a phase curve
Step 1: D raw a curve o f potential U (x) Vs x , w here U (x) as vertical axis and x as horizontal axis.
Step 2: Just below of potential U(x) vs x curve, draw momentum P(x) as vertical axis and x as horizontal axis.
Step 3: For different values of constant energy in U(x) Vs x draw the trend of P(x) vs x in all classical allowed region.
Step 4: Use sign convention as mention above.
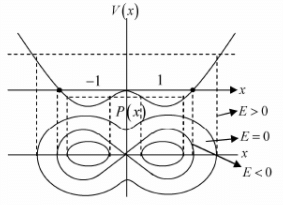
Example 4: If potential in one dimension is given by V(x) = -x2/2 + x4/4 phase curve i.e. curve between momentum px as function of x for all possible range of energy E .
To plot phase curve first one should plot potential (V vs x) , then on the same axis one should plot momentum with common x axis.
We can check how momentum is changing with position keeping in mind how potential is changing with position.
One will plot the phase curve by assuming that if the potential is increasing, then kinetic energy will be decreasing and if the potential is decreasing, then kinetic energy will be increasing because total energy will always remain constant. One should plot the phase curve for different range of energy.
For example in the given potential, there are three range of energy.
Case 1: If -1/4 < E < 0 the particle has motion about stable equilibrium point x = 1,-1 the 4motion is bounded.
Case 2: If 0 < E < ∞ the particle has motion about unstable equilibrium point x = 0 the motion is bounded.
Case 3: At E = 0 the particle can be landed exactly at unstable equilibrium point which is nature of transition from case 1 to case 2.
Example 5: If potential in one dimension is given by V(x) = - kx2 then plot the phase curve i.e. curve between momentum px as function of x for all possible range of energy E.
To plot phase curve first one should plot potential (V vs x), then on the same axis one should plot momentum with common x axis . We can check how momentum is changing with position keeping in mind how potential is changing for a given value of energy. For given value of potential the phase curve is hyperbolic as shown in equation
One will plot the phase curve by assuming that if the potential is increasing, then kinetic energy will be decreasing and if potential is decreasing then kinetic energy will be increasing, because total energy will always remain constant. One should plot the phase curve for different range of energy. For example in this potential there are three range of energyCase 1: E < 0 , the particle will come from -∞. As it is approaches the potential its kinetic energy as well as momentum decreases finally became zero at turning point A and turn back towards -∞ with increasing kinetic energy and momentum.
Same trend will also follow when particle approaching the potential from x = ∞, for turning point A'.
Case 2: E > 0 , the particle will come from x = -∞. As it approaches the potential, its kinetic energy as well as momentum decreases till x = 0 . As it crosses x = 0 and move towards x = ∞, again kinetic energy as well as momentum increases and same trend will be followed, when particle approaches the potential to x = ∞.
Case 3: E = 0 , the particle can reach at x = 0 , which is unstable equilibrium point and that phase curve will also be separated between E < 0 and E> 0, identified as separatix.-kx2 for E = 0 ⇒ px ∝ ± x which is straight line.
Example 6: The energy of simple pendulum is given by  , mga cosθ, where pe is angular momentum and - mga cosθ is potential energy.
One will plot the phase curve by assuming that if the potential energy is increasing, then kinetic energy will be decreasing and if the potential energy is decreasing then kinetic energy will be increasing, because total energy will always remain constant. One should plot the phase curve for different range of energy. For example in this potential there are three range of energy.
The stable equilibrium point is θ = 0, θ = - π and θ = π are unstable equilibrium points.
Case 1: For energy - mga < E < mga particle is bounded about stable equilibrium point so phase curve is periodic.
Case 2: For energy E > mga motion will become unbounded and phase curve will be a periodic. Liberation will take place.
Case 3: For energy E = mga particle will reach at unstable equilibrium point it also separate two type of motion (mention in case 1 and case 2) identified as separatix.
|
61 videos|23 docs|25 tests
|
FAQs on Stability Analysis & Phase Diagram - Mechanics & General Properties of Matter - Physics
| 1. What is an energy diagram and how is it used in stability analysis? |  |
| 2. How can stability analysis be applied in the context of phase diagrams? |  |
| 3. What factors can affect the stability of a system in energy diagrams? |  |
| 4. How can energy diagrams be used to predict the feasibility of a reaction or process? |  |
| 5. Can energy diagrams be used to determine the equilibrium state of a system? |  |


