Unit Test: Data Through Pictures | Mathematics (Maths Mela) Class 5 - New NCERT PDF Download

Time: 1 hour M.M. 20
Attempt all questions.
- Each question carries 5 marks
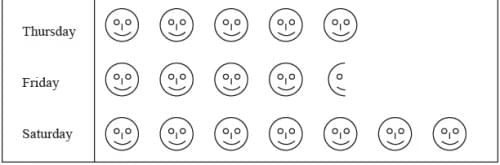
Q1: Tim recorded the number of donuts sold over five days. (5 marks)
Read the chart and answer the questions.
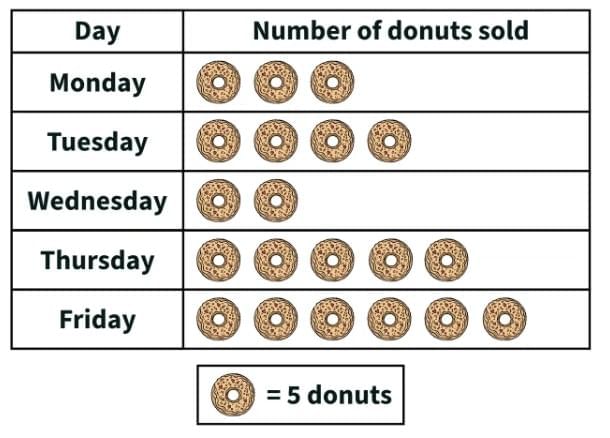
- How many donuts did he sell on Thursday?
- Which day did he sell the least donuts?
- Which day did he sell the most donuts?
- Which day did he sell 20 donuts?
- Which day did he sell 15 donuts?
Q2: The pictograph shows how many snowballs each child made. Use the pictograph to answer the given questions. (5 marks)
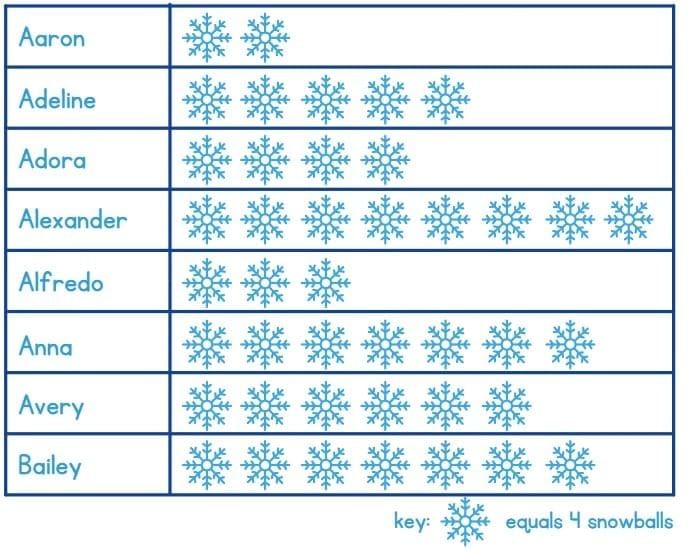
(i) How many snowballs did Alfredo make?
(ii) How many snowballs did Aaron make?
(iii) Name two people who made the same number of snowballs.
(iv) How many more snowballs did Bailey make than Adeline?
(v) How many more snowballs did Alexander make than Adora?
Q3: Following is the pictograph of class VI students. Here 1 (5 marks) = 10 boys and 1
  = 10 girls. Looking at the pictograph below, answer the following questions.
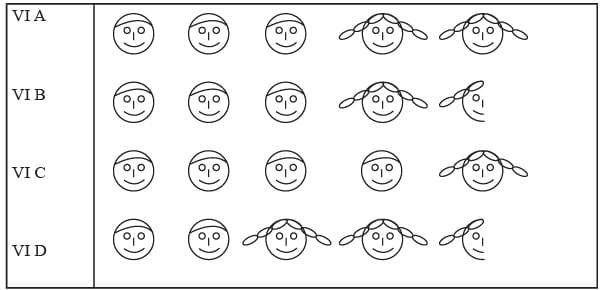
(i) How many students are there in VI A, VI B, VI C and VI D sections each? __________
(ii) Which section has maximum number of boys? __________
(iii) Which section has maximum number of girls? __________
(iv) What is the total strength of class VI? __________
Q4: The number of students present in class VI during a particular week is given below. It is represented by a pictograph where 1  = 6 students. (5 marks)
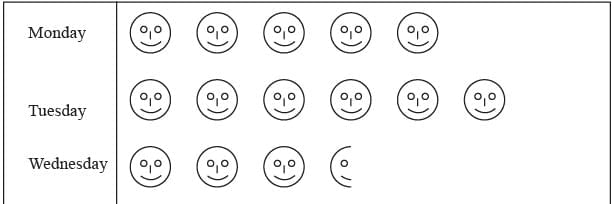
(i) On which day maximum students were present? __________
(ii) On which day minimum students were present? __________
(iii) How many students were present on wednesday and Thursday each? __________
Q5: A survey showed the preference of different subjects by students of class VI (5 marks)
| Subject | No. of Students |
| English | 25 |
| Hindi | 30 |
| Maths | 50 |
| Science | 35 |
| Social Science | 40 |
Draw a pictograph to illustrate the above data taking a scale of 1 students.
Q6: The following pictograph shows the number of pears in 6 bags (5 marks)
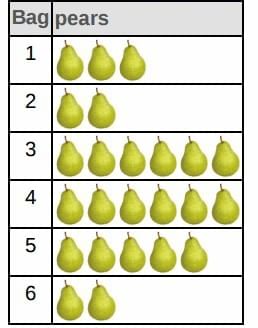 Find the following.
(a) Bag with the maximum number of pears.
(b) Bag with the minimum number of pears.
(c) Total number of pears in all the bags.
(d) Total number of pears in all the bags 1 & 2.
(e) How many more pears does bag 4 have than bag 2?
You can access the solutions to this Unit Test here.
|
35 videos|276 docs|7 tests
|
FAQs on Unit Test: Data Through Pictures - Mathematics (Maths Mela) Class 5 - New NCERT
| 1. What are the different types of data representation used in pictures? |  |
| 2. How can pictures enhance the understanding of data for Class 5 students? | |
| 3. What skills can students develop by learning about data through pictures? | |
| 4. Why is it important for Class 5 students to learn about data representation? | |
| 5. How can teachers effectively teach data representation through pictures in the classroom? | |


Summary
,Free
,Unit Test: Data Through Pictures | Mathematics (Maths Mela) Class 5 - New NCERT
,Sample Paper
,Unit Test: Data Through Pictures | Mathematics (Maths Mela) Class 5 - New NCERT
,MCQs
,Viva Questions
,video lectures
,ppt
,Extra Questions
,past year papers
,Unit Test: Data Through Pictures | Mathematics (Maths Mela) Class 5 - New NCERT
,mock tests for examination
,study material
,Important questions
,practice quizzes
,Objective type Questions
,Exam
,Previous Year Questions with Solutions
,shortcuts and tricks
,Semester Notes
;


Unit Test: Data Through Pictures Free PDF Download
Importance of Unit Test: Data Through Pictures
Unit Test: Data Through Pictures Notes
Unit Test: Data Through Pictures Class 5 Questions
Study Unit Test: Data Through Pictures on the App
|
© EduRev
|
Education Revolution
|


|


