Class 10 Exam > Class 10 Notes > Mathematics for GCSE/IGCSE > Using Graphs
Using Graphs | Mathematics for GCSE/IGCSE - Class 10 PDF Download
Solving Equations Using Graphs
How do we use graphs to solve equations?
- Solutions are always read off the x-axis.
- Solutions of f(x) = 0 are where the graph of y = f(x) intersects the x-axis.
- If asked to use the graph of y = f(x) to solve a different equation, the question will indicate to do so by drawing a suitable straight line.
- Rearrange the equation to be solved into the form f(x) = mx + c and draw the line y = mx + c.
- Solutions are the x-coordinates where the line y = mx + c intersects the curve y = f(x).
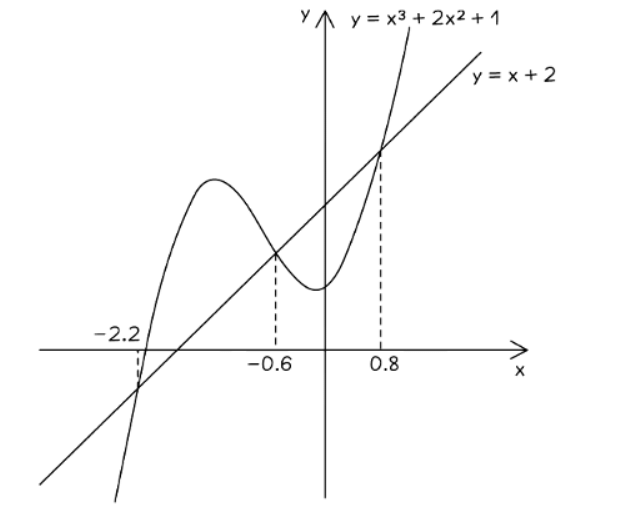
- For example, given the curve for y = x3 + 2x2 + 1 and asked to solve x3 + 2x2 − x − 1 = 0;
- Rearrange x3 + 2x2 − x − 1 = 0 to x3 + 2x2 + 1 = x + 2.
- Draw the line y = x + 2 on the graph of y = x3 + 2x2 + 1.
- Read the x-values where the line and the curve intersect. In this case, there are three solutions, approximately x = −2.2, x = −0.6, and x = 0.8.
- Note that solutions may also be called roots
How do we use graphs to solve linear simultaneous equations?
- Plot both equations on the same set of axes using the straight-line forms y = mx + c.
- Find where the lines intersect (cross).
- The solutions to the simultaneous equations are the x and y coordinates of the intersection point.
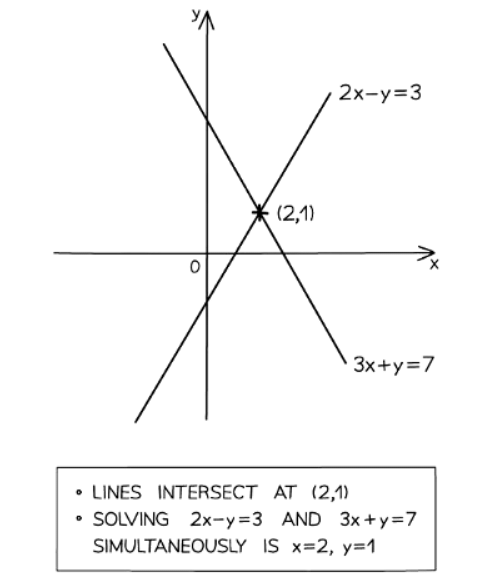
- For example, to solve 2x − y = 3 and 3x + y = 4 simultaneously:
- First, plot both equations on the graph.
- Identify the point of intersection, which in this case is (2, 1).
- The solution is x = 2 and y = 1.
How do we use graphs to solve simultaneous equations where one is quadratic?
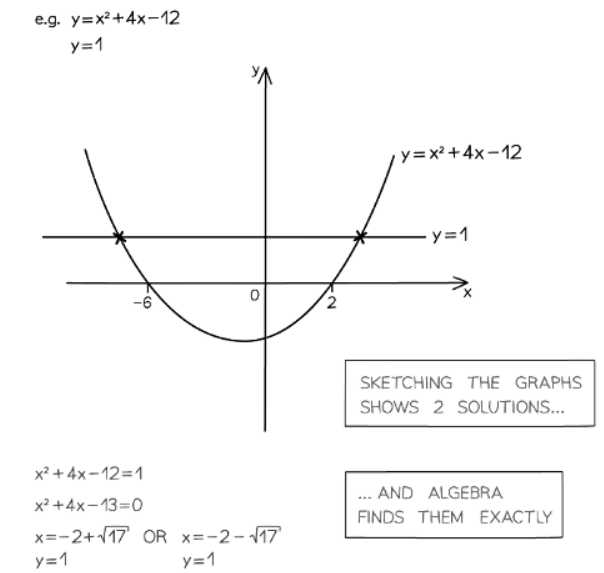
- For example, to solve y = x2 + 4x − 12 and y = 1 simultaneously:
- First, plot both equations on the same graph.
- Identify the two points of intersection by reading off the scale. In this case, they are approximately (−6.1,1) and (−2.1,1)(−2.1,1) to one decimal place.
- The solutions from the graph are approximately x = −6.1 and y = 1, and x = −2.1 and y = 1.
- Note that there are two pairs of x, y solutions.
- To find exact solutions, use algebra.
Finding Gradients of Tangents
What is the gradient of a graph?
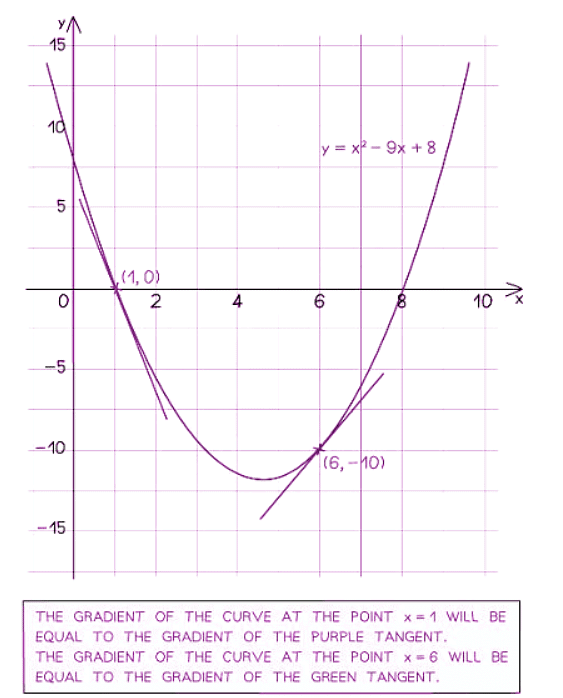
- The gradient of a graph at any point is equal to the gradient of the tangent to the curve at that point.
- A tangent is a line that just touches a curve without crossing it.
How do I estimate the gradient under a graph?
- To estimate the gradient:
- Draw a tangent to the curve.
- Calculate the gradient of the tangent using the formula: Gradient = Rise ÷ Run.
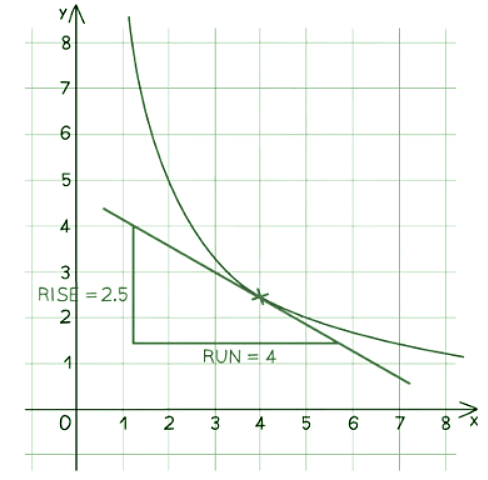
- In the example above, the gradient at x = 4 would be

- It's important to note that when we visually estimate the gradient by drawing a tangent, it is not exact.
- To find the precise gradient, we would need to use differentiation.
What does the gradient represent?
- In a y-x graph, the gradient signifies the rate of change of y concerning x.
- This concept finds applications in various real-world scenarios.
- For instance, in a distance-time graph, the gradient represents the rate of change of distance with respect to time, which equates to speed.
- Similarly, in a speed-time graph, the gradient corresponds to the rate of change of speed with respect to time, which denotes acceleration.
The document Using Graphs | Mathematics for GCSE/IGCSE - Class 10 is a part of the Class 10 Course Mathematics for GCSE/IGCSE.
All you need of Class 10 at this link: Class 10
|
82 videos|394 docs|60 tests
|
FAQs on Using Graphs - Mathematics for GCSE/IGCSE - Class 10
| 1. What is the significance of finding gradients of tangents using graphs in solving equations? |  |
Ans. Finding gradients of tangents using graphs helps in understanding the rate of change of a function at a specific point, which is crucial in solving equations that involve variables and their rates of change.
| 2. How can graphing be used to solve equations involving tangents? |  |
Ans. By graphing a function and its tangent line at a specific point, we can visually determine the gradient of the tangent, which can be used to find the equation of the tangent line and solve related equations.
| 3. Can finding gradients of tangents using graphs help in determining the maximum and minimum points of a function? |  |
Ans. Yes, by analyzing the gradients of tangents at different points on a function's graph, we can identify where the function has maximum and minimum values, which is useful in optimization and critical point analysis.
| 4. How does the slope of a tangent line relate to the derivative of a function at a specific point? |  |
Ans. The slope of a tangent line at a specific point on a function's graph is equal to the derivative of the function at that point. This relationship is fundamental in calculus and is used to find instantaneous rates of change.
| 5. In what situations would finding the gradients of tangents using graphs be more advantageous than using algebraic methods? |  |
Ans. Graphical methods are particularly useful when dealing with complex functions or when a visual representation can provide better insights into the behavior of the function. In such cases, finding gradients of tangents using graphs can offer a more intuitive approach to solving equations.
Related Searches


