UPSC Exam > UPSC Notes > CSAT Preparation > Venn Diagrams: Introduction & Solved Examples
Venn Diagrams: Introduction & Solved Examples | CSAT Preparation - UPSC PDF Download
What is a Venn Diagram?
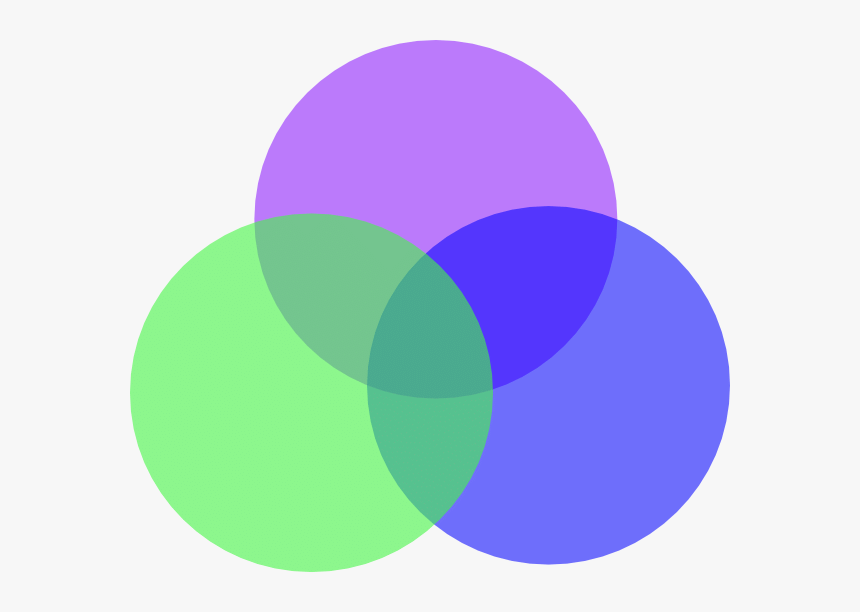
- A Venn diagram (also called a set diagram or logic diagram) is a diagram that shows all possible logical relations between a finite collection of different sets.
 Venn Diagram
 - Typically overlapping shapes, usually circles, are used, and an area-proportional or scaled Venn diagram is one in which the area of the shape is proportional to the number of elements it contains.
- These diagrams represent elements as points in the plane and sets as regions inside curves. An element is in a set S just in case the corresponding point is in the region for S. They are thus a special case of Euler diagrams, which do not necessarily show all relations.
- Venn diagrams were conceived around 1880 by John Venn. They are used to teach elementary set theory, as well as illustrate simple set relationships in probability, logic, statistics, linguistics and computer science.
Examples
- In the following figure, the small square represents the persons who know English, the triangle represents those who know Marathi, the big square represents those who know Telugu and the circle represents those who know Hindi.
- In the figure, different regions from 1 to 12 are given.
Q1. How many persons can speak English and Hindi both languages only?
A. 5
B. 8
C. 7
D. 18
Correct Answer is Option (A).
- Number of persons who can speak English and Hindi both only is 5.
Q2. How many persons can speak Marathi and Telugu both?
A. 10
B. 11
C. 13
D. None of these
Correct Answer is Option (C).
6 + 7 = 13.
Q3. How many persons can speak only English?
A. 9
B. 12
C. 7
D. 19
Correct Answer is Option (B).
- Number of persons were can speak English is 12.
Q4. How many persons can speak English, Hindi and Telugu?
A. 8
B. 2
C. 7
D. None of these
Correct Answer is Option (B).
- Number of persons who can speak English, Hindi and Telugu is 2.
Q5. How many persons can speak all the languages?
A. 1
B. 8
C. 2
D. None
Correct Answer is Option (D).
- There is no such person who can speak all the languages.
The document Venn Diagrams: Introduction & Solved Examples | CSAT Preparation - UPSC is a part of the UPSC Course CSAT Preparation.
All you need of UPSC at this link: UPSC
|
208 videos|138 docs|138 tests
|
FAQs on Venn Diagrams: Introduction & Solved Examples - CSAT Preparation - UPSC
| 1. What is the purpose of a Venn Diagram? |  |
| 2. How do you create a Venn Diagram? |  |
Ans. To create a Venn Diagram, start by drawing one or more overlapping circles or ovals. Each circle represents a set of data, and the overlapping regions represent the similarities or intersections between the sets. Label each circle with the name of the set and fill in the overlapping region accordingly.
| 3. What are the properties of a Venn Diagram? |  |
Ans. A Venn Diagram has several properties. It must have a universal set that includes all the elements being considered. The diagram should display all possible intersections between the sets accurately. The regions within the circles should represent the elements belonging exclusively to each set, while the overlapping regions represent the shared elements.
| 4. How can Venn Diagrams be used in problem-solving? |  |
Ans. Venn Diagrams are helpful in problem-solving as they provide a visual representation of the relationships between sets. They can be used to determine the number of elements in various intersections, calculate probabilities, analyze survey data, and identify logical relationships between different categories.
| 5. Can Venn Diagrams be used for more than two sets of data? |  |
Ans. Yes, Venn Diagrams can be used to represent more than two sets of data. In such cases, additional circles or ovals are added, and the overlapping regions become more complex. These diagrams are known as multi-set Venn Diagrams and are useful for analyzing relationships between multiple categories or data sets.
Related Searches


