Theory Of Demand (Theory of Consumer Behaviour) Class 12 Economics

Demand
- Demand for a commodity: Defined by the quantity a consumer is willing to purchase and can afford, considering the product's price, along with the consumer's tastes and preferences.
- Common usage: In everyday language, the terms desire, wants, and demand are often used interchangeably.
- Economic distinction: However, in economics, these terms each have unique meanings.
Let’s us understand the 3 different terms:
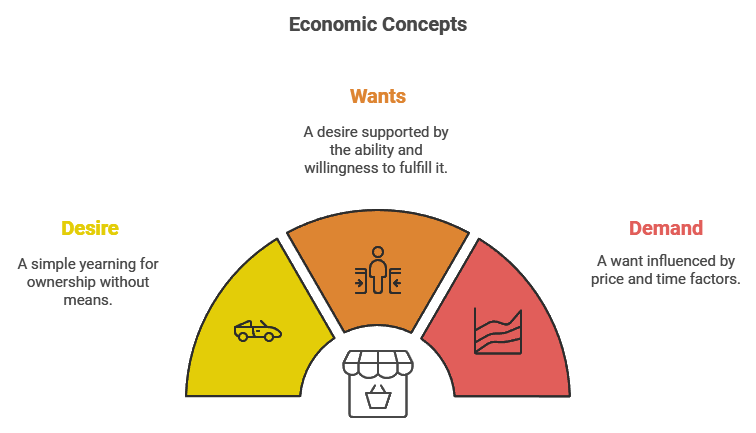
Desire: Essentially a mere wish for a commodity, without the means to acquire it.
- Example: A poor person's wish for a car, despite having only Rs. 200, illustrates desire as a simple yearning for ownership.
Wants: A desire that is bolstered by the capability and willingness to fulfil it. Not every desire becomes a want; a transformation occurs when the individual can afford to satisfy the desire.
- Example: The earlier mentioned poor person winning a lottery and acquiring sufficient funds to purchase a car turns the initial desire into a want.
Demand: An evolution of wants, distinguished by two additional specifics:
- Price Dependency: Demand is intrinsically linked to the commodity's price, asserting that the quantity demanded varies with price fluctuations—increasing demand at lower prices and decreasing at higher ones. Hence, demand is undefined without considering price.
- Time Relevance: Demand is always articulated in relation to a specific time frame, indicating that demand levels can shift even if the price remains constant, based on the time period in focus.
- Example: Umbrella demand spikes during the rainy season compared to other times, demonstrating how demand is not static but varies over different periods (hour, day, month, year) and can be applicable to an individual or the market at large.
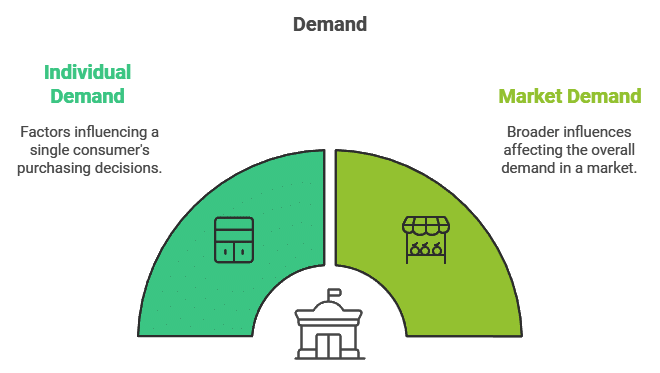
Individual Demand:
- Defined as the specific quantity of a commodity that a single consumer is both willing and capable of purchasing at various price levels within a specified timeframe.
Market Demand:
- Represents the total quantity of a commodity that all consumers combined are willing and able to purchase at different price points over a designated period.
Demand Function
Illustrates the relationship between the quantity demanded of a specific commodity and the factors that influence it.
Individual Demand Function
- Defines the functional relationship between individual demand and the factors affecting it.
- Expressed as: Dx=f(Px,Pr,Y,T,F)
- Where Dx = Demand for commodity x
- Px = Price of the commodity x
- Pr = Price of related goods
- Y = Income of the consumer
- T = Taste and preference
- F = Expectation of future price changes
- Indicates that the quantity demanded (Dx ), on the left-hand side, depends on the variables on the right-hand side.
Market Demand Function
- Describes the functional relationship between market demand and the factors affecting market demand.
- Affected by all factors influencing individual demand, plus additional factors such as the size and composition of the population, seasonal and weather variations, and income distribution.
- Expressed as: = ( , , , , , , , ) Dx =f(Px ,Pr ,Y,T,F,Po,S,D)
- Where D x = Demand for commodity x
- Px = Price of the commodity x
- Pr = Price of related goods
- Y = Income of the consumer
- T = Taste and preference
- F = Expectation of future price changes
- Po = Size and composition of the population
- S = Season and weather
- D = Distribution of income
Determinants of Individual Demand
- Price of the commodity itself.
- Price of related goods.
- Consumer's income.
- Consumer tastes and preferences.
- Expectations of future price changes.
Determinants of Market Demand
- Size and composition of the population.
- Seasonal and weather conditions.
- Distribution of income among the population.
Demand Schedule
- A table detailing quantities of a commodity demanded at different price levels within a specified time period.
- Illustrates the relationship between commodity price and quantity demanded.
- Exists in two forms: Individual Demand Schedule and Market Demand Schedule.
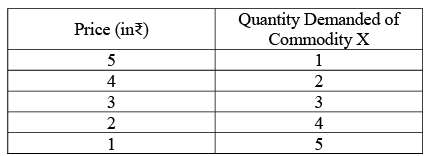
Individual Demand Schedule:
- Shows various quantities of a commodity a single consumer is willing to purchase at different prices during a defined time period.
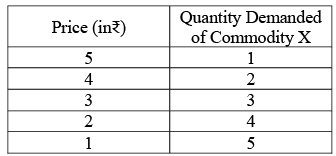
- As seen in the schedule, the quantity demanded of ‘x’ increases with decreases in its price. The consumer is willing to buy 1 unit at Rs.5. When the price falls to Rs.4, demand rises to 2 units.
Market Demand Schedule:
- Market demand schedule refers to a tabular statement showing various quantities of a commodity that all the consumers are willing to buy at various levels of price, during a given period of time. It is the sum of all individual demand schedules at each and every price. Market demand schedule can be expressed as Dm = DA+DB+………..... Where Dm is the market demand and DA+DB+…… are the individual demands of Household A, Household B and so on.
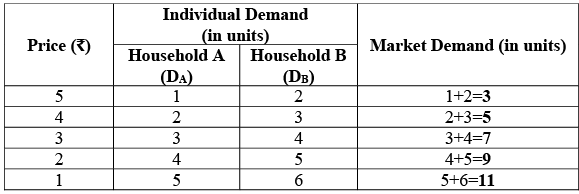
- Market demand is obtained by adding demand of households A and B at different prices. At Rs.5 per unit, market demand is 3 units. When the price falls to Rs.4, market demand rises to 5 units. So, the market demand schedule also shows the inverse relationship between price and quantity demanded.
Demand Curve
- A graphical representation of the demand schedule.
- Connects points representing quantities of a commodity desired by a consumer at different prices, over a specific period, assuming other factors remain constant.
- Demonstrates the inverse relationship between the price of a commodity and the quantity demanded, with all other factors held constant.
- Can be constructed for any commodity by graphing each point from the demand schedule.
- Exists in two varieties: Individual Demand Curve and Market Demand Curve.
Individual Demand Curve:
- Individual demand curve refers to a graphical representation of individual demand schedule.
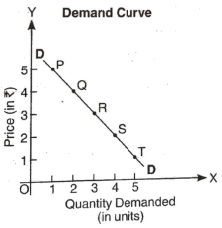
- As seen in the diagram, the price is taken on the vertical axis (Y-axis) and the quantity demanded on the horizontal axis (X-axis). At each possible price, there is a quantity, which the consumer is willing to buy. By joining all the points (P to T), we get a demand curve ‘DD’.
Market Demand Curve
- The market demand curve refers to a graphical representation of the market demand schedule. It is obtained by horizontal summation of individual demand curves.
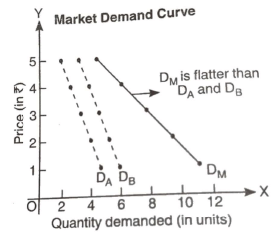
- DA and DB are the individual demand curves. The market demand curve (DM) is obtained by horizontal summation of the individual demand curves.
Law of Demand
- Describes an inverse relationship between price and quantity demanded, assuming all other factors remain constant.
- Also referred to as the 'First Law of Purchase'.
Assumption of Law of Demand
The phrase "keeping other factors constant" is integral to the law of demand, encapsulating several critical assumptions:
- The price of substitute goods remains unchanged.
- Prices of complementary goods are constant.
- The consumer's income does not vary.
- There are no anticipated changes in prices in the future.
- Consumer tastes and preferences remain consistent.
The understanding of the law of demand is enhanced through the use of tables and graphs.
Demand Schedule
 This clearly shows that more and more units of a commodity are demanded when the price of the commodity falls. Demand curve DD slopes downwards from left to right, indicating an inverse relationship between price and quantity demanded.
Why Other factors are kept constant?
- The demand for a commodity is influenced by various factors, not just its price.
- To isolate the impact of a single factor on demand, it's essential to keep all other factors constant.
- Thus, when examining the 'Law of Demand', it is presumed that there are no changes in other influencing factors.
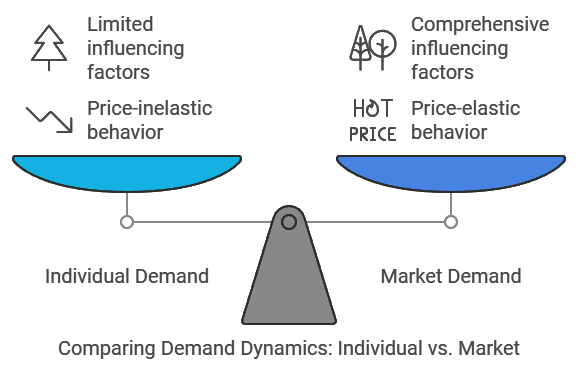
Individual Demand Vs Market Demand
Individual Demand
- Represents the quantity of a commodity demanded by a single consumer at a specific price within a certain timeframe.
- May or may not adhere to the Law of Demand; an individual might demand more of a commodity even if its price increases.
- Not influenced by all factors that impact market demand.
Market Demand
- The total quantity of a commodity demanded by all consumers at a specific price during a specified period.
- Always conforms to the Law of Demand; meaning, market demand decreases as price increases, and vice versa.
- Affected by all factors that influence individual demand.
Substitute Goods and Complementary Goods
Substitute Goods
- Substitute goods are those goods that can be used in place of one another for the satisfaction of a particular want, like tea and coffee. Demand for a given commodity varies directly with the price of a substitute good. For Eg: if the price of a substitute good (say, coffee) increases, then demand for the given commodity (say, tea) will rise as tea will become relatively cheaper in comparison to coffee.
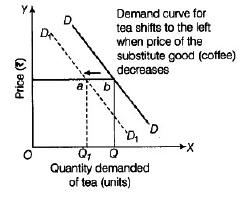
- As seen in the given diagram, the price of coffee (substitute good) is shown on the Y-axis and the demand for tea (given commodity) on the X-axis. When the price of coffee rises from OP and OP1 demand for tea also rises from OQ to OQ1
Complementary Goods
Complementary goods are those goods that are used together to satisfy a particular want. Demand for a given commodity varies inversely with the price of a complementary good. For Eg: if the price of a complementary good (say, sugar) increases, then demand for the given commodity (say, tea) will fall as it will be relatively costlier to use both goods together.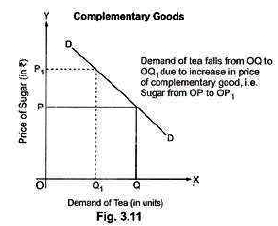 As seen in the given diagram, the price of sugar (complementary good) is shown on the Y-axis and the demand for tea (a given commodity) is on the X-axis. When the price of sugar rises from OP to OP1 demand for tea falls from OQ to OQ1
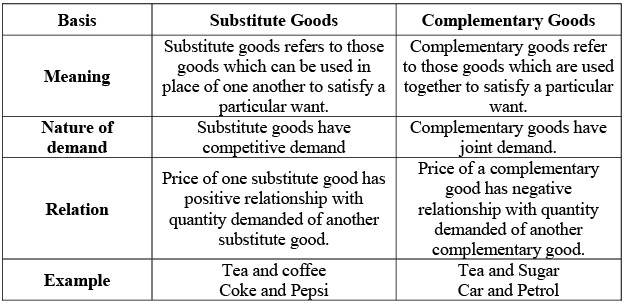
Normal Goods and Inferior Goods
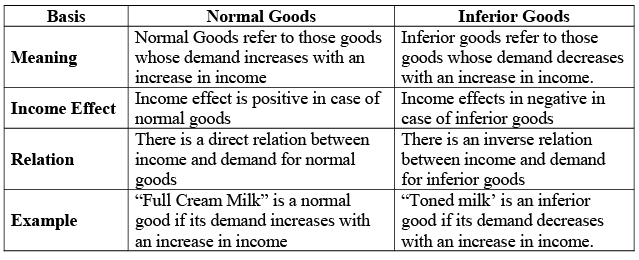
Normal Goods
- Commodities frequently purchased are typically normal goods.
- A consumer tends to buy more normal goods as their income increases and less when their income decreases.
- Normal goods are defined by their demand increasing with an increase in consumer income.
- Example: A TV is considered a normal good if its demand increases with a rise in income.
- The income effect is positive for normal goods, indicating demand moves in the same direction as income changes.
Inferior Goods
- Inferior goods are characterized by a decrease in demand as consumer income increases.
- There is an inverse relationship between income levels and demand for inferior goods, indicating a negative income effect.
- Example: When a consumer's income rises and they opt to replace a black-and-white TV with a colour TV, the demand for the black-and-white TV drops, classifying it as an inferior good.
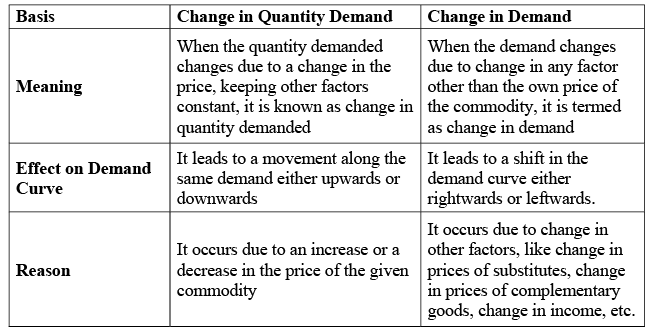
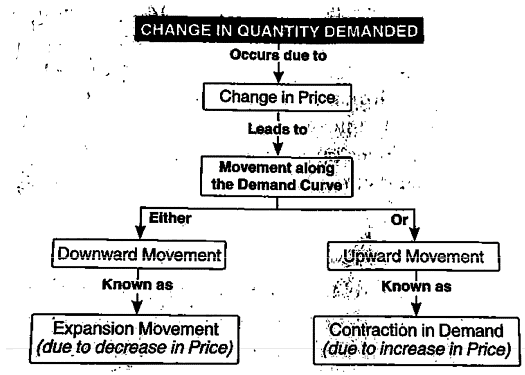
Change in Quantity Demanded Vs Change in Demand
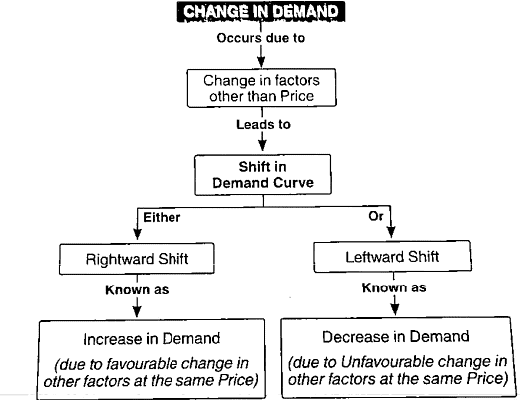
Shift in Demand Curve (Change in Demand)
- The demand curve illustrates the relationship between a commodity's price and the quantity demanded, with all other factors held constant.
- Changes in factors other than the commodity's own price will inevitably occur, leading to a shift in the demand curve.
- A shift in the demand curve due to any factor aside from the commodity's own price is referred to as a change in demand.
Various Reasons for Shift in Demand Curve
- Change in the price of substitute goods.
- Change in the price of complementary goods.
- Change in consumer income levels.
- Alterations in consumer tastes and preferences.
- Expectations of future price changes.
- Variations in population size.
- Shifts in income distribution.
- Changes in season and weather conditions.
Illustration of the demand curve shift concept through diagrams
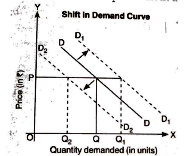
In demand for the commodity is OQ at a price of OP. Change in other factors leads to a rightward or leftward shift in the demand curve:
- Rightward shift: When demand rises from OQ to OQ1 (known as an increase in demand) at the same price of OP, it leads to a rightward shift in the demand curve from DD to D1D1.
- Leftward shift: On the other hand, a fall in demand from OQ to OQ2 (known as a decrease in demand) at the same price of OP, leads to a leftward shift in the demand curve from DD to D2D2
Increase in Demand
- An increase in Demand refers to a rise in the demand for a commodity caused due to any factor other than the price of the commodity. In this case, demand rises at the same price or demand remains the same even at a higher price. An increase in demand leads to a rightward shift in the demand curve.
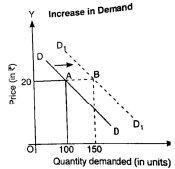
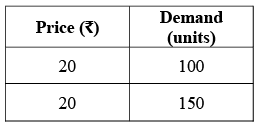
- As seen in the given schedule and diagram, demand rises from 100 units to 150 units at the same price of Rs.20, resulting in a rightward shift in the demand curve from DD to D1D1.
- Decrease in Demand Decrease in Demand refers to a fall in the demand for a commodity caused due to any factor other than the price of the commodity. In this case, demand falls at the same price or demand remains the same even at a lower price. It leads to a leftward shift in the demand curve.
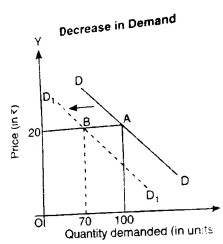
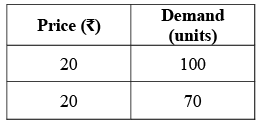
- As seen in the given schedule and diagram, demand falls from 100 units to 70 units at the same price of Rs.20 resulting in a leftward shift in the demand curve from DD to D1D1.
Movement Along the Demand Curve (Change in Quantity Demanded)
- When quantity demanded of a commodity changes due to a change in its price, keeping other factors constant, it is known as a change in quantity demanded. It is graphically expressed as a movement along the same demand curve. There can be either a downward movement or an upward movement along the same demand curve. Let us understand the movement along the demand curve. OQ quantity is demanded at a price of OP. Change is price leads to an upward or downward movement along the same demand curve.
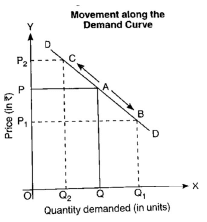
- Upward movement: When price rises to OP2, quantity demanded falls to OQ2 leading to an upward movement from A to C along the same demand curve DD.
- Downward Movement: On the other hand, a fall in price from OP to OP1 leads to an increase in quantity demanded from OQ to OQ1 resulting in a downward movement from A to B along the same demand curve DD. Expansion in Demand Expansion in demand refers to a rise in the quantity demanded due to a fall in the price of a commodity and other factors remaining constant.
- It leads to a downward movement along the same demand curve.
- It is also known as ‘Extension in Demand’ or ‘Increase in Quantity Demanded’. It can be better understood from the table and graph.
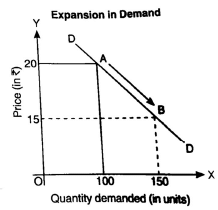
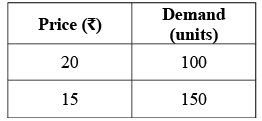
- As seen in the given schedule and diagram, the quantity demanded rises from 100 units to 150 units with a fall in the price from Rs.20 to Rs.15, resulting in a downward movement from A to B along the same demand curve DD.
Contraction in Demand
- Contraction in demand refers to a fall in the quantity demanded due to a rise in the price of commodity other factors remaining constant.
- It leads to an upward movement along the same demand curve.
- It is also known as ‘Decrease in Quantity Demanded’. It can be better understood from table and graph
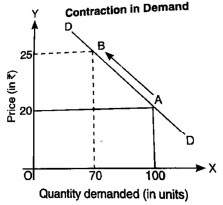
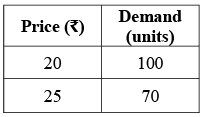
- As seen in the given schedule and diagram, the quantity demanded falls from 100 units to 70 units with a rise in the price from Rs.20 to Rs.25, resulting in an upward movement from A to B along the same demand curve DD.
Elasticity of Demand
The law of demand outlines the relationship between price and quantity demanded, stating that when the price of a good decreases, the quantity demanded increases. However, it does not specify the extent of this change. The concept of elasticity of demand helps quantify how much the quantity demanded changes in response to a price change.
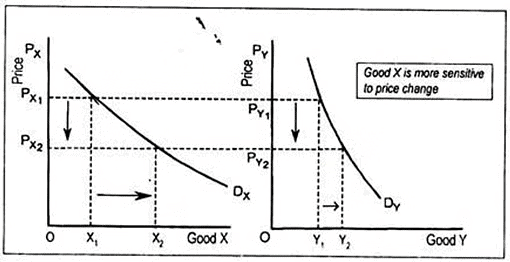
Understanding Responsiveness of Demand
In the illustration of demand curves for goods X and Y, both are downward sloping. When both goods are priced at PX1 and PY1(where PX1 = PY1), a consumer demands OX1 units of good X and OY1 units of good Y at these prices.If the prices for both goods decrease to PX2 and PY2, the quantity demanded for good X increases to OX2 and for good Y to OY2. If the increase in quantity demanded for good X is greater than that for good Y, it indicates that good X is more responsive to price changes than good Y. This responsiveness is what we refer to as the elasticity of demand.
Price Elasticity of Demand
Price elasticity of demand specifically measures how much the quantity demanded of a commodity responds to changes in its own price while keeping income and the prices of related goods constant.
Mathematically, price elasticity of demand is defined as: Alternatively, it can also be expressed as the absolute value of the ratio of the percentage change in quantity to the percentage change in price. Thus, elasticity of demand is inherently a relative concept, allowing for comparisons of how different goods react to price changes.
The Formula for Calculating Elasticity of Demand
The price elasticity of demand (EP) can be calculated using the following formula:

This can be expressed mathematically as:
EP = 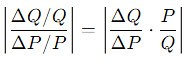
Where:
- ΔQ = Change in quantity demanded
- ΔP = Change in price
The vertical lines indicate that we take the absolute value of the ratio. Since price and quantity move in opposite directions, the elasticity (EP) will typically yield a negative value. To simplify, we drop the negative sign and use the absolute value.
For example, if we calculate:
EP = 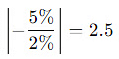
This result shows that the price elasticity is a unitless number, making it independent of the units used for measurement (e.g., kilograms, litres). Thus, the percentage change in demand remains consistent regardless of how quantity is measured.
Types of Price Elasticity of Demand
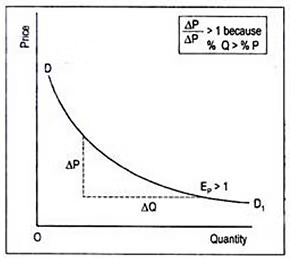
The responsiveness of quantity demanded to changes in price varies across different types of goods. This leads to five distinct categories of price elasticity of demand:Elastic Demand (EP > 1):
- Definition: Demand is elastic if the percentage change in quantity demanded is greater than the percentage change in price.
- Example: For luxury goods, a 10% decrease in price may result in a more than 10% increase in quantity demanded.
- Illustration: If the price of gold decreases from Rs. 160 to Rs. 140 and demand rises from 1,000 kg to 2,000 kg:
 EP= 1,000/1,000 ÷ 20/160 = 1,000/20 .160/1,000 = 8
 - Since EP > 1, gold is considered a luxury item.
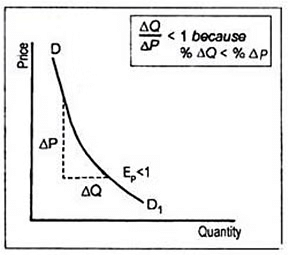
Inelastic Demand (EP < 1):
- Definition: Demand is inelastic if the percentage change in quantity demanded is less than the percentage change in price.
- Example: For necessary goods, a 10% decrease in price might lead to a 1% increase in quantity demanded.
- Illustration: If the price of wheat drops from 40 paise to 20 paise, and demand rises from 1,600 kg to 2,000 kg:
 EP= 400/160 ÷ 20/40 = 400/20. 40/1,600 = 0.5
 - Since EP < 1, wheat is categorized as a necessary good.
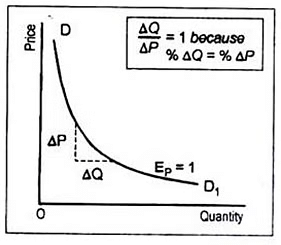
Unit Elasticity of Demand (EP = 1):
- Definition: Demand has unit elasticity when the percentage change in quantity demanded equals the percentage change in price.
- Example: A 10% decrease in price results in a 10% increase in quantity demanded.
- Illustration: If the price of a commodity falls from Rs. 200 to Rs. 100, and demand rises from 400 kg to 800 kg:
 EP= 400/400 ÷ 100/100 = 400/100. 100/400 = 1
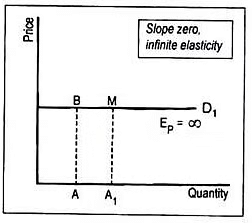
Perfectly Elastic Demand (EP = ∞):
- Definition: Demand is perfectly elastic if a slight change in price leads to an infinitely large change in quantity demanded.
- Illustration: The demand curve is horizontal, indicating that consumers will only buy at one price. This situation is typical in perfectly competitive markets for individual firms.
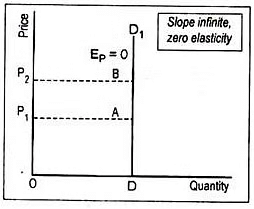
Perfectly Inelastic Demand (EP = 0):
- Definition: Demand is perfectly inelastic if the quantity demanded does not change regardless of price changes.
- Illustration: The demand curve is vertical, indicating that the quantity demanded remains constant at any price. This can apply to essential medications or other non-substitutable goods.
Measurement of Elasticity of Demand
There are three primary methods for measuring elasticity of demand:Total Outlay (Revenue) Method:
- Concept: Proposed by Alfred Marshall, this method uses the relationship between total revenue (TR) and price changes to assess elasticity.
- Definition: Total revenue (or total outlay) is calculated as: TR = P × Q
- Analysis:
1. Elastic Demand (EP > 1): If the price decreases and total revenue increases, demand is elastic. Conversely, if the price increases and total revenue decreases, demand remains elastic.
2. Inelastic Demand (EP < 1): If the price decreases and total revenue decreases, demand is inelastic. If the price increases and total revenue increases, demand is still inelastic.
3. Unit Elasticity (EP = 1): A change in price does not affect total revenue, indicating unit elasticity.
Point Elasticity Method:
- Concept: This method calculates elasticity at a specific point on the demand curve.
- Formula: EP =

- Explanation: Here, dQ/dP represents the derivative of quantity with respect to price, showing how quantity demanded changes at a particular price level. This method is particularly useful for calculating elasticity when dealing with small changes in price and quantity.
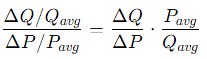
Arc Elasticity Method:
- Concept: This method measures elasticity over a range of prices, providing an average elasticity between two points on the demand curve.
- Formula:
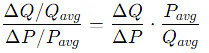
- Explanation:
- ΔQ is the change in quantity demanded.
- ΔP is the change in price.
- Qavg and Pavg are the average quantity and price, respectively, over the range considered.
- Usefulness: This method is effective for measuring elasticity in cases where there are larger changes in price and quantity.
Relationship between Total Expenditure and Price of Elasticity of Demand
- Ed=1 When total spending (price X quantity) remains constant despite a rise or reduction in the price of a good.
- Ed>1 When prices fall, total expenditure rises, and when prices rise, total expenditure falls.
- Ed<1 When total expenditure falls as a result of a price decrease and total expenditure rises as a result of a price increase.
Factors Determining Elasticity of Demand
The elasticity of demand is influenced by several key factors:Nature of the Commodity:
- Essential Goods: Generally have inelastic demand because price changes do not significantly affect the quantity demanded. Examples include basic necessities like food and medicine.
- Luxury Goods: Tend to have elastic demand. Consumers can reduce their consumption when prices rise and increase it when prices fall. For instance, a TV may be considered a luxury for low-income individuals but a necessity for higher-income individuals.
Availability of Substitutes:
- Close Substitutes: Commodities with many substitutes exhibit elastic demand. For example, if the price of Horlicks rises, consumers may switch to Complan or other similar products.
- Few Substitutes: Commodities with fewer or no substitutes tend to have inelastic demand. Price changes have less impact on the quantity demanded.
Extent of Uses:
- Multiple Uses: Commodities used for various purposes, like electricity, usually have elastic demand. A decrease in electricity prices can lead to reduced use of alternatives (e.g., coal or gas).
- Single Use: Commodities with limited uses are less sensitive to price changes, resulting in inelastic demand.
Habitual Consumption:
- Habitual Goods: Items consumed out of habit or convention (e.g., cigarettes) often exhibit inelastic demand. Even if prices rise, habitual users are less likely to reduce consumption.
Time Dimension:
- Short Run vs. Long Run: Demand tends to be more inelastic in the short run because consumers may not have immediate alternatives. In the long run, as substitutes become available or consumers adjust, demand may become more elastic.
The Importance of Being Unimportant:
- Small Budget Share: If a product constitutes a small part of a consumer's budget, they are less sensitive to price changes. For example, a slight increase in train fare for infrequent travelers may not significantly affect their travel decisions.
Durability:
- Durable Goods: These typically have elastic demand. For instance, if refrigerator prices rise, consumers may postpone their purchase. Conversely, non-durable goods, which are consumed quickly, often exhibit inelastic demand.
The elasticity of demand is shaped by the nature of the commodity, the availability of substitutes, the extent of its uses, habitual consumption patterns, the time frame for adjustments, the relative importance of price changes in the consumer's budget, and the durability of the goods. Understanding these factors helps businesses and policymakers predict consumer behavior in response to price changes.
Importance of the Concept of Elasticity of Demand
The concept of elasticity of demand plays a crucial role in both theoretical and practical economics. Its applications span various economic problems and decision-making processes:1. Price Determination
- Market Conditions: Elasticity of demand is vital for determining prices under different market structures. In perfect competition, if demand falls while supply remains fixed, prices will drop, and vice versa. A stable price environment is influenced by the elasticity of both demand and supply.
- Agricultural Economics: For agricultural products, inelastic demand can lead to economic hardship for farmers if they increase production without a corresponding rise in demand. Policymakers can use this understanding to implement measures to stabilize farmers' income.
- Monopoly Pricing: A monopolist must understand the elasticity of demand for their product. They will focus on producing in the elastic range of the demand curve to maximize revenue.
2. Wage Determination
- Collective Bargaining: Elasticity informs wage negotiations. Trade unions can successfully push for higher wages if labour demand is inelastic since firms have fewer options for substituting labour with machines.
- Impact on Employment: The elasticity of demand for the product affects how changes in wages impact employment levels. For elastic demand, a rise in wages may lead to a larger contraction in employment compared to inelastic demand, which is more resistant to changes in labour costs.
3. Policy Determination
- Taxation: For an effective tax policy, the elasticity of demand for the taxed goods is crucial. Taxes are typically levied on goods with inelastic demand to ensure stable revenue generation. Understanding elasticity helps in predicting the burden of taxes on consumers.
- Incidence of Tax: The ability to shift tax burdens depends on demand elasticity. With inelastic demand, producers can pass on the tax burden to consumers more easily.
4. Exchange Rate Determination
- International Trade: Elasticity of demand is essential for understanding currency devaluation's effects on a country's balance of payments. A successful devaluation hinges on the elasticities of demand for exports and imports.
- Terms of Trade: The elasticity of demand influences the terms of trade between countries, affecting how goods are exchanged internationally.
|
59 videos|222 docs|43 tests
|
FAQs on Theory Of Demand (Theory of Consumer Behaviour) Class 12 Economics
| 1. What is the Law of Demand and how does it affect consumer behavior? |  |
| 2. What are substitute goods and complementary goods? | |
| 3. How do normal goods and inferior goods differ in terms of consumer demand? | |
| 4. What is the difference between a change in quantity demanded and a change in demand? | |
| 5. What is elasticity of demand and why is it important for businesses? | |


Theory Of Demand (Theory of Consumer Behaviour) Class 12 Economics
,MCQs
,past year papers
,Free
,Extra Questions
,ppt
,shortcuts and tricks
,Semester Notes
,practice quizzes
,study material
,Theory Of Demand (Theory of Consumer Behaviour) Class 12 Economics
,Objective type Questions
,Previous Year Questions with Solutions
,Sample Paper
,Exam
,Theory Of Demand (Theory of Consumer Behaviour) Class 12 Economics
,Viva Questions
,video lectures
,Important questions
,mock tests for examination
,Summary
;


Chapter Notes - Theory Of Demand (Theory of Consumer Behaviour) Free PDF Download
Importance of Chapter Notes - Theory Of Demand (Theory of Consumer Behaviour)
Chapter Notes - Theory Of Demand (Theory of Consumer Behaviour)
Chapter Notes - Theory Of Demand (Theory of Consumer Behaviour) Commerce Questions
Study Chapter Notes - Theory Of Demand (Theory of Consumer Behaviour) on the App
|
© EduRev
|
Education Revolution
|


|


