Introduction (Statistics for Economics) Class 11 Economics
| Table of contents |
|
| Why Economics? |
|
| Consumption, Production and Distribution |
|
| Statistics in Economics |
|
| What is Statistics? |
|
| What Statistics Does? |
|
| Conclusion |
|

Why Economics?
- Alfred Marshall defines economics as the study of human behaviour in everyday life situations, particularly in business activities.
- A consumer is someone who uses goods and services to fulfil their desires or needs.
- Consumption refers to utilizing goods and services to satisfy our wants or needs directly.
- A producer is an individual or entity that creates or sells goods and services with the aim of generating income.

- Production involves the process of transforming raw materials into useful goods or services.
- Saving is the portion of income that is not spent on consumption and involves the practice of restraining immediate consumption.
- Economic activity refers to the production, distribution, and consumption of goods and services. It encompasses all actions that involve the use of resources (such as labour, capital, and land) to produce goods and services that satisfy human wants and needs.
- The economic problem arises due to the scarcity of resources and the existence of alternative uses for those resources, resulting in the need to make choices.
- Investment refers to the expenditure made by producers to acquire assets that can generate income.
- An employee refers to an individual who receives payment in the form of salary or wages from an employer for the work they provide.
- An employer, in economics, is an individual or organization that hires one or more employees to produce goods or services by offering them compensation in the form of salary or wages.
We cannot get something for nothing
- In Aladdin and his Magic Lamp, Aladdin’s wishes are instantly fulfilled by a genie.
- In real life, we aren’t so lucky.
- While we have unlimited wants, resources like money are limited, forcing us to prioritize our needs.
- This is the essence of scarcity, the root of all economic problems.
- Scarcity exists because resources are limited and have alternative uses.
- For example, the same land can grow food or cash crops like cotton.
- This creates the problem of choice—deciding how to best use limited resources.
- Economics helps us understand these trade-offs in daily life.

Consumption, Production and Distribution
- We're interested in understanding the decision-making process of a consumer, considering their income and numerous purchasing options, in relation to prices. This is referred to as the study of consumption.
- We are also interested in understanding the producer's decision-making process regarding what and how to produce for the market, which is the focus of the production study.
- We're interested in understanding the distribution of a country's total income or GDP, through wages, profits, and interest, excluding income from international trade and investment. This is the study of Distribution.
In addition to the three traditional areas of Economics study, modern economics also involves specialized studies on the fundamental issues faced by the country. Disasters impact our lives significantly, hence the need for Statistics in modern economics courses. This subject studies number-based facts systematically, which is crucial in understanding economics. Do you agree with the widely accepted definition of economics now?
“Economics is the study of how people and society choose to employ scarce resources that could have alternative uses in order to produce various commodities that satisfy their wants and to distribute them for consumption among various persons and groups in society.”
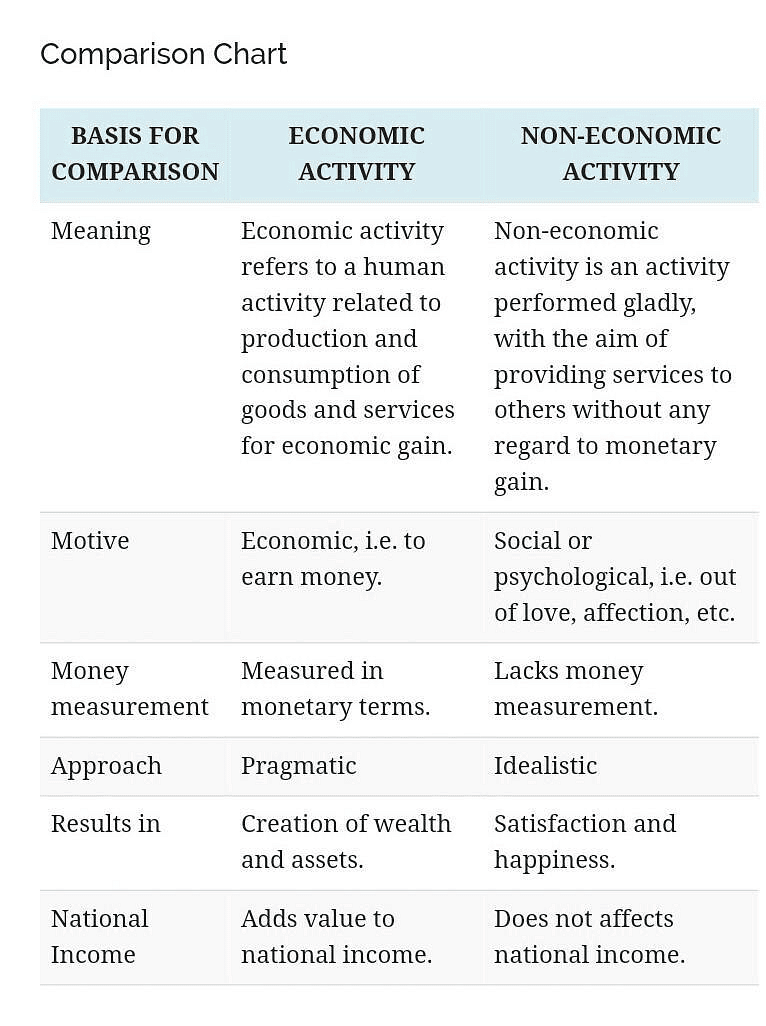
Difference Between Economic and Non-Economic Activity
Statistics in Economics
- There is a need for special studies addressing a country's fundamental issues, requiring a deeper understanding of economic facts or data.
- The aim of gathering this data is to comprehend and dissect these issues, pinpointing their root causes.
- For instance, analyzing poverty would involve understanding factors like unemployment, low productivity, and outdated technology.
- The analysis of poverty is crucial in developing measures or policies to alleviate it. Without data on the diverse factors that contribute to an economic issue, it is impossible to analyze the problem or create effective policies to address it.
- This highlights the fundamental relationship between Economics and Statistics.

What is Statistics?
Statistics is the study of collecting, analyzing, interpreting, presenting, and organizing data. In other words, it is a mathematical discipline that aims to collect and summarize data. According to statistician Sir Arthur Lyon Bowley, statistics is defined as "numerical statements of facts in any department of inquiry placed in relation to each other."
- Plural Sense Statistics refers to information in terms of numbers or numerical data, such as population statistics, employment statistics etc.
- A Singular Sense refers to techniques or methods relating to the collection, classification, presentation analysis and interpretation of quantitative data.

What Statistics Does?
- Economists can present economic facts accurately and unambiguously with the help of statistics.
- Statistics aid in summarizing large amounts of data into a few numerical measures.
- Statistical analysis is employed to identify the correlation between various economic factors.
- Statistical studies are useful in economic forecasting.
- Statistics can assist in developing appropriate economic policies that address economic issues.
- It helps in evaluating the effectiveness of previously implemented policies.
- Economists seek to establish causal relationships between different sets of data using statistical methods.
- Policies can be formulated using statistical information.
- Statistics is utilized in making inter-sectoral and inter-temporal comparisons.
- Statistics offers a quantitative representation of economic problems.
Functions of Statistics
- Complexities can be simplified with the help of statistics.
- Statistics uses numerical values to express facts.
- Data is presented in a condensed form through statistics.
- Statistics compares various phenomena and establishes their relationships.
- Statistics aids in policy formation.
- Economic forecasting is made possible through statistics.
- Statistics facilitates comparisons between different sets of data.
- Other scientific laws can be tested using statistics.
- A correlation between two facts can be established with the help of statistics.

Limitations of Statistics
- The focus of statistics is not on individuals but on groups or aggregates.
- The interpretation of statistical results can sometimes lead to erroneous conclusions.
- Statistics is concerned with numerical or quantitative data only.
- Statistical laws are generally applicable to averages and not to individual cases.
- Statistics can be best utilized by experts with appropriate knowledge and skills.
- Data uniformity and homogeneity are essential in statistical analysis.
- Misuse of statistics can be its greatest limitation as it is susceptible to such misuse.
- Statistics deals with the study of aggregates and not with individual cases.
- It is important to have proper context and reference to ensure an accurate interpretation of statistical results.
Statistical methods are no substitute for common sense!
- There is a funny story that makes fun of statistics.
- A family of four, which includes a husband, a wife, and their two children, decided to cross a river.
- The father was aware of the average depth of the river.
- He also calculated the average height of his family members.
- Since the average height of his family was taller than the average depth of the river, he believed it would be safe for them to cross.
- As a result, while they were crossing, some family members, specifically the children, ended up drowning.
- This raises the question: is the problem with how the averages were calculated or how they were misused?

Conclusion
- Statistics is crucial in analyzing economic issues like rising prices, unemployment, and poverty, helping devise and evaluate policies.
- For instance, statistical techniques can determine if family planning effectively controls population growth.
- Statistics also aids decision-making in economic policies.
- For example, to decide how much oil India should import in 2025, we must know the expected domestic production and demand.
- This information, essential for making such decisions, is only possible through statistical analysis.
|
58 videos|215 docs|44 tests
|
FAQs on Introduction (Statistics for Economics) Class 11 Economics
| 1. Why is economics considered an important field of study? |  |
| 2. How does statistics play a role in economics? | |
| 3. What are the main types of statistical methods used in economics? | |
| 4. What is the significance of consumption, production, and distribution in economics? | |
| 5. How can one apply statistical methods to solve economic problems? | |

|
21.4K Views |

|
4.69/5 Rating |

|
Dec 22, 2024 Last updated |

|
Explore Courses for Commerce exam
|
|
Exam
,Sample Paper
,past year papers
,shortcuts and tricks
,Extra Questions
,practice quizzes
,ppt
,Important questions
,Free
,video lectures
,Introduction (Statistics for Economics) Class 11 Economics
,study material
,Semester Notes
,Summary
,Introduction (Statistics for Economics) Class 11 Economics
,MCQs
,mock tests for examination
,Viva Questions
,Previous Year Questions with Solutions
,Objective type Questions
,Introduction (Statistics for Economics) Class 11 Economics
;


Chapter Notes - Introduction (Statistics for Economics) Free PDF Download
Importance of Chapter Notes - Introduction (Statistics for Economics)
Chapter Notes - Introduction (Statistics for Economics)
Chapter Notes - Introduction (Statistics for Economics) Commerce Questions
Study Chapter Notes - Introduction (Statistics for Economics) on the App
|
© EduRev
|
Education Revolution
|


|


