
1. Vernier Callipers - It is used to measure internal and external diameter and depth of a vessel
- A vernier callipers is an instrument that is used to measure distances correctly upto 0.1 mm or 0.01 cm. The diagram of vernier callipers is shown below.
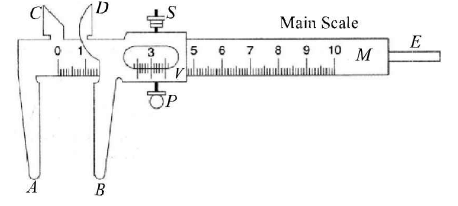
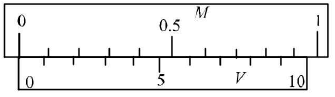
- Vernier callipers has a main scale M (in millimetres), a sliding vernier scale V, fixed jaws A and C, movable jaws B and D projected at right angles to the main scale and a thin metallic strip E attached to the back side of M and connected with vernier scale.
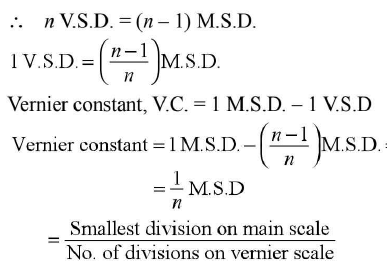
- Vernier constant or least count of a vernier The difference between the values of one main scale division and one vernier scale division is known as vernier constant. This is the smallest distance that can be accurately measured with the vernier scale. So, it is called least count of vernier scale.
Let n vernier scale division (V.S.D.) coincide with (n - 1) main scale division (M.S.D.)
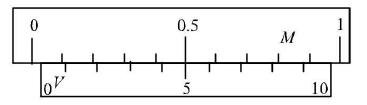
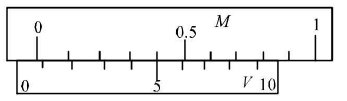
Reading a vernier scale If the zero of vemier scalelies a head of Nth division of main scale,then main scale readmg(M.S.R) is N.
If nth division of the vernier scale coincides with any division of main scale, then vernier scale reading (V.S.R.) is n x V.C.
where n = coinciding division of vernier scale.
Total reading (T.R.) = M.S.R. + V.S.R = N+ n * (V.C.)Zero error and zero correction Zero error: If the zero of the vernier scale does not coincide with the zero of the main scale, then the instrument has an error called zero error.
Zero correction: It has a magnitude equal to zero error but its sign is opposite to that of zero error.
Positive and negative zero error: Zero error can be positive or negative depending upon whether the zero of vernier scale lies to the right or to the left of the zero of the main scale.
Zero error is positive when the zero of the vernier scale lies to the right of the main scale when jaws A and B are in contact.
Zero error is negative when the zero of vernier scale lies to the left of zero of the main scale when jaws A and B are in contact.
Zero error is nil when zero vernier scale coincides with zero of main scale when jaws A and B are in contact.
To measure the diameter of a given ball we clamp the ball gently between the jaws of callipers avoiding excessive pressure. Note the main scale reading (x) before the zero of vernier scale. Look for the coinciding vernier scale division. Let it be y.
Observed diameter, D = x + y x V.C.
Corrected diameter D' = D ± zero correction Corrected diameter, D' = D + (zero error) If zero error is positive, then it is substracted. When it is negative, then added.
The upper jaws of vernier callipers are used to measure the internal dimensions of a body such as diameter of a tube/beaker etc.
The sliding strip of vernier callipers is used to measure the depth of a vessel.
2. Screw gauge - Its use to determine thickness/diameter of thin sheet/wire.A screw gauge is used to measure even smaller dimensions than those measure by vernier callipers. It is used to measure distances upto 0.01 mm or 0.001 cm.
The principle of screw gauge is that linear motion of screw of screw gauge is directly proportional to the rotational motion. The labelled diagram of a screw gauge is shown below.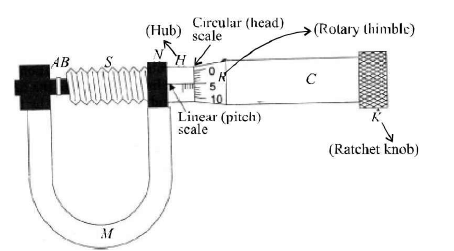
- The rotatory thimble (R) is subdivided into 100 equal divisions. It is called circular or head scale. The thimble passes through a frame known as hub (H) that carries a millimetre scale graduated on the reference line. This scale is called linear scale or pitch scale. The jaw can be adjusted by rotating the thimble using a small ratchet knob (AT).
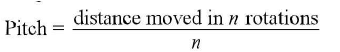
- The least count of a screw gauge depends on (i) pitch, (ii) number of divisions on circular scale Pitch of a screw gauge: It is defined as the linear distance moved by the screw in one complete rotation of its head,
- The screw gauge used in laboratories have a pitch of 1 mm.
Least count of the screw gauge: It is defined as the distance moved by the screw when circular scale is rotated through one division on it.
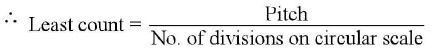
The circular scale has usually 100 divisions on it.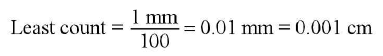
So, the screw gauge has more accuracy in measurement than vernier callipers.
Reading of screw gauge: If the edge of the cap lies ahead of ,Vh division of linear scale, then linear scale reading (L.S.R.) is N.
- If 12th division of circular scale lies over a reference line, then circular reading (C.S.R.) is n x (L.C.)
(where L.C. is least count of screw gauge.)
Total reading (T.R.) = L.S.R. + C.S.R. = N + n x (L.C.) - Zero error and zero correction
Zero error in screw gauge arises when the zero of circular scale does not coincide with zero on the reference line of graduation, when the screw gauge is completely closed. - Zero error is positive, when zero of circular scale lies below the line of graduation. » Zero error is negative, when zero of circular scale lies above the line of graduation.
In either case, we note circular scale reading on the line of graduation, and multiply it with least count of screw gauge. - Zero correction has a magnitude equal to zero error, but its sign is opposite to that of zero error.
- To measure the diameter of a wire, close the screw gauge carefully holding the wire in
between till the ratchet gives a tick. Note the linear scale reading x and circular scale reading y.Observed diameter, D = x + y * L.C.
Corrected diameter, D ’ = D ± zero correction.
Backlash error in a screw gauge arises when we suddenly reverse the sense of rotation of circular scale. The backlash error developes on account of worn out threadings. Backlash error can be avoided by rotating the screw in the same sense.
Simple Pendulum: Dissipation of energy by plotting a graph between square of amplitude and time A simple pendulum consists o f a heavy point mass m ( called bob) hanging from perfectly inextensible, flexible and weightless string of length / and fixed at a pivot point P. When displaced to an initial angle and released, the pendulum will swing back and forth with periodic motion.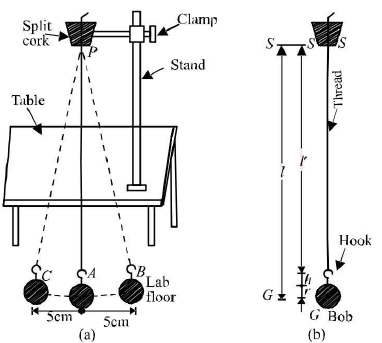
- A is the mean position. B and C are the extreme positions. The length of the pendulum is the distance between the point of suspension of the pendulum and its centre of gravity, i.e.Length of the simple pendulum = length of the thread + length of the hook of bob + radius of bob. l = T + h + r
Dissipation of energy by plotting a graph between square of amplitude and time.
Principle: When a pendulum swings in air, it eventually stops. This happens as the air drag and the friction at the support, oppose the motion of the pendulum and dissipate its energy gradually.
For a simple harmonic oscillator the restoring or the spring force is represented by
Fs = -kx where x is the displacement from the equilibrium position. For damping, we can take an additional drag force opposite and proportional to its velocity.
Fd = -bv
Thus total force acting on the oscillator
F = -kx - bv.
Using Newton’s second law.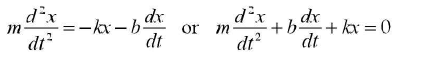
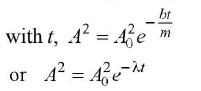
The solution to this differential equation is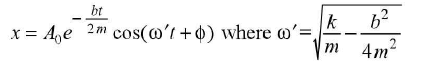
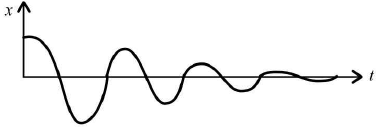
We can regard the displacement as a sine function whose amplitude which is Age lm gradually decreases with time.
The energy of a undamped mechanical oscillator is constant, and is given by
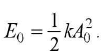 If the oscillator is damped, the mechanical energy is not constant but decreases with time.
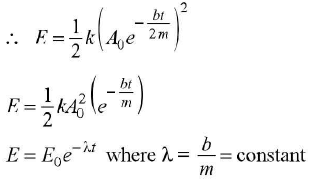
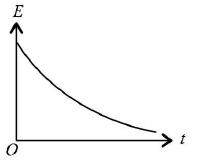
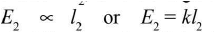
Alternatively, if we plot the amplitude A at any given time t,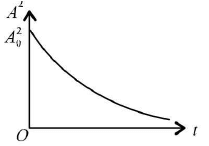
As energy is proportional to A2 for an oscillator, the graph o' shows the dissipation of energy with time.
- Metre Scale - Mass of a given object by principle of moments Like physical balance, a metre scale can be used as a beam balance making use of principle of moments.
- Principle: A metre scale is supported at its centre of gravity on a wedge as shown.
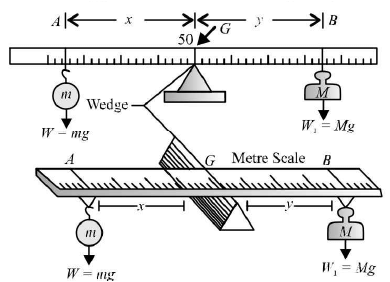
- As unknown mass m of weight mg is suspended from the left arm at a distance x and a known standard mass M o f weight Mg is suspended from the right arm at a distance y.
The distances are measured from the wedge. For equilibrium, the moments of forces about the wedge is equal.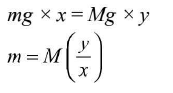
5.Young's modulus of elasticity of the material of a metallic wire - Elasticity: It is the property of the body by virtue of which the body regains its original configuration when the deforming force is removed.Young’s modulus (Y) is a measure of the stiffness of a given material. It is known as modulus of elasticity. It is defined as the ratio of normal stress to the longitudinal strain.
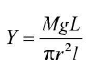
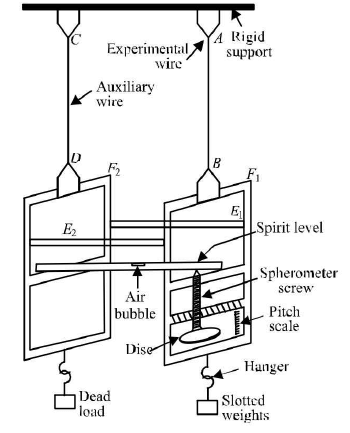
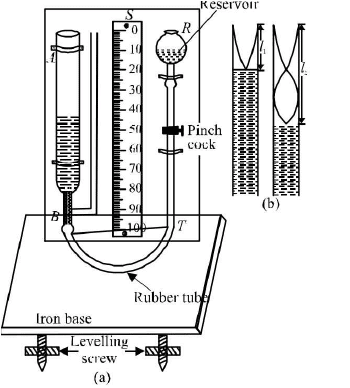
where M= mass of wire, L = length of wire, l = increase in length, r = radius of wire - The S.I. unit o f 7 is Nm-2 and C.G.S. unit is dyne cm-2.Young’s modulus Y of the given material of the wire is determined by using Searle’s apparatus. The labelled diagram of Searle’s apparatus is shown in the figure below.
- Young’s modulus of a body depends upon the nature of material of wire and is independent of dimensions of the wire.
- Young’s modulus of elasticity is for solid body only. For liquid and gases, it is zero. Greater is the value of Y for a material, larger is its elasticity. As values of Y for copper and steel, are 1.1 x 10¹¹ N/m2 and 2.0 x 10¹¹ N/m2, so steel is more elastic than copper.
- Surface tension of water by capillary rise and effect of detergents Surface tension is that characteristic property of a liquid by virtue of which, its free surface possess a tendency to contract so as to acquire a minimum possible surface area.
- Rise of liquid in capillary tube (Ascent formula) Let a capillary tube of radius r be dipped in a liquid which makes concave meniscus in the tube.
- Let R = radius of curvature of liquid meniscus, P = atmospheric pressure, S = surface tension of the liquid.
- The pressure at point A, just above the liquid meniscus in the capillary tube is atmospheric pressure =P.
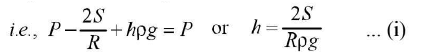
The pressure at point B, just below the liquid meniscus =

Pressures at points C and D just above and below the plane surface of liquid in the vessel is also P (atmospheric pressure). The points B and D are in the same horizontal plane in liquid but the pressure at these points is different. Hence there will be no equilibrium.
In order to maintain an equilibrium, the liquid level rises in the capillary tube up to a height h so that the pressures at points D and E which are in the same level in liquid may become equal.
Pressure at E = pressure at B + pressure due to height (h) of the liquid column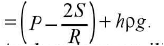
As there is an equilibrium, pressure at E = pressure at D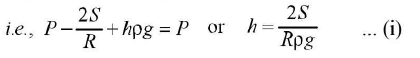
To find R (radius of curvature of liquid) from figure. GI = R; GO = r, <IGO = 0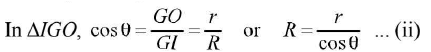
Put the value o f R from equation (ii) in equation (i), we get h= 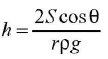
It gives the height of the column lifted and also known as ascent formula. hrpg From ascent formula; 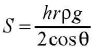
- Effect of detergents: When a detergents added to water reduces the surface tension of water. For a given capillary tube, the rise of water in it varies directly with the surface tension. So, on adding a detergent to water its surface tension decreases. More is the decrease in surface tension, lesser would be rise of water in capillary tube.
- Coefficient of viscosity of a given viscous liquid by measuring terminal velocity of a given spherical velocity Viscosity is the property of a fluid (liquid or gas) by virtue of which an internal frictional force comes into play when the fluid is in motion and opposes the relative motion of its different layers. It also called fluid friction.
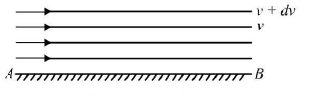
- When a liquid flows over a flat surface, liquid layer in contact with fixed surface AB does not move. Upper layers move forward with increasing velocity. Due to relative motion, a backward dragging force F acts tangentially to every layer which is given by
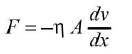
 is constant of proportionality called coefficient of viscosity.
Definition : If A= 1, dv/dx = 1, then F =  .
.
Hence, coefficient of viscosity may be defined as the tangential force required to maintain a unit velocity gradient between two layers of unit area.
- The SI. unit of coefficient of viscosity is poiseuille (PI).
- Terminal velocity: The maximum velocity acquired by the body, falling freely in a viscous medium is called terminal velocity.
- Considering a small sphere of radius r of density p falling freely in a viscous medium of density (σ). The forces acting on it are :
The weight of the sphere acting downward =
The upward thrust = weight o f the liquid displaced by sphere The effective downward force
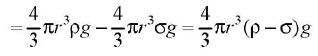
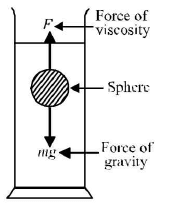 Upward force of viscosity:
When the downward force is balanced by the upward force of viscosity, the body falls down with constant velocity called terminal velocity.
Hence,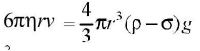
Plotting a cooling curve for the relationship between the temperature of a hot body and time
- A hot body can be subjected to natural cooling or a forced cooling by using conduction, convection or radiation.
- When loss of heat is by radiation only and surroundings are maintained at a constant low temperature, we can use Newton’s law of cooling.
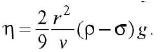
- According to Newton’s law of cooling, when difference in temperature of a body and its surroundings is small, then the rate of loss of heat of the body is directly proportional to difference in temperatures of the body and the surroundings.
 where θ = temperature of the bodyθ0 = temperature of surroundings
K = constant of proportionality
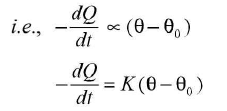
As Q = smθ,where m is mass and 5 is specific heat of the body.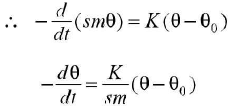
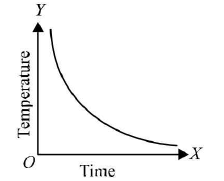
The variation of temperature of body with time is parabolic as shown in the figure.
Equation (ii) can be rewritten as
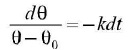
where k= k/sm = constant.
Integrating both sides of equation (iii),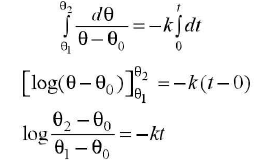
Here θ1 is initial temperature at zero time and temperature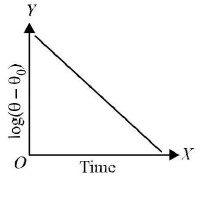
The graph between log(θ - θ0) and time is a straight line as shown aside.
9. Speed of sound in air at room temperature using a resonance tube.
- A resonance tube is a tube open on one-side and closed at the other by water surface. The tube is made to resonate with a tuning fork for two different positions.
- Principle: The resonance tube works on the phenomena of resonance of air column.
Let l1 and l2 be the lengths of the air columns for the first and the second resonances respectively with a tuning fork of frequency v. Then,
 = 2(l2 - l1)
As v = , v = ,
 2(l2 - l1)
Therefore, speed o f sound at room temperature is given by v = 2 ( l2 - I1).
10. Specific heat capacity of a given (i) solid and (ii) liquid by method of mixtures.
- Specific heat capacity of a substance is defined as the amount of heat required to raise the temperature of unit mass of the substance through unit degree.
When two substances at different temperatures are mixed, then heat is exchanged between them. The substance at higher temperature loses heat and the one at lower temperature gains heat till they come to an equilibrium temperature. This is the law of mixtures.
Principle of mixtures: The amount of heat lost by the hotter body equals the amount of heat gained by the colder body provided (i) no heat is lost to the surroundings and (ii) the substances do not react chemically to produce or absorb heat.
For body of mass m, having a specific heat s, the amount of heat gained or lost AQ is given by
ΔQ = msΔθwhere Δθ is the rise or fall in the temperature of the body.
Method of mixtures
Solid: The solid is weighed to find its mass in, heated in boiling water at temperature θ3 for 10 minutes as shown in the figure.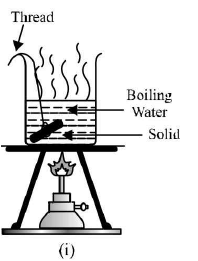
(i), then quickily transferred to a calorimeter of mass mc containing a mass of water mw at temperature θ, as shown in figure.
(ii).The water is stirred and the highest reading θ2 on the thermometer noted.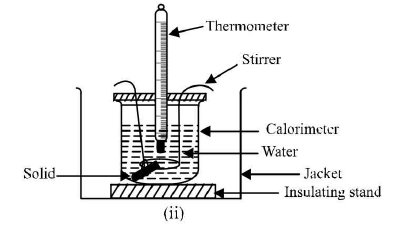
Assuming no heat loss from the calorimeter when the hot solid is dropped into it. We have heat given out by solid cooling from θ3 to θ2
= heat received by water warming from θ1 to θ2 + heat received by calorimeter warming from θ1 to θ2.
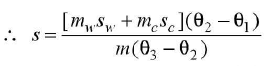
If s is the specific heat capacity of the solid, so that of water and sc that o f the calorimeter, then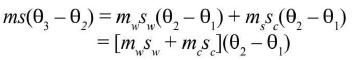
Liquid: In this case a hot solid of known specific heat capacity is dropped into the liquid whose specific heat capacity is required; the procedure and calculations are the same as that of solid.
11. Resistivity of the material of a given wire using Metre Bridge
- Metre bridge is the practical form of Wheatstone bridge.
In a metre bridge, P and Q are the ratio arms of fixed resistance, R is an adjustable or variable resistance of known value. X is the unknown resistance and balance point is obtained at B on the metre bridge wire. Since the bridge uses 1 metre long wire, it is called metre bridge. Since a jockey is slided over the wire, it is called slide wire bridge.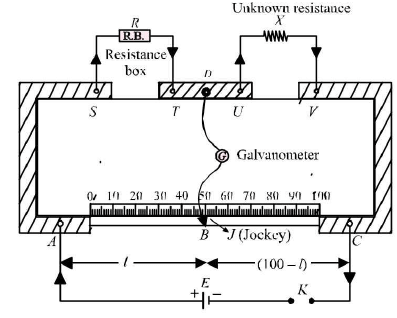
Let AS = l cm and BC = (100 - l ) cm.
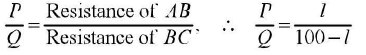
According to Wheatstone’s bridge,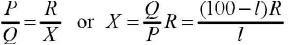
For specific resistance,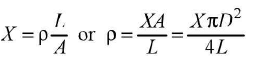
12. Resistance of a given wire using Ohm’s law
To find the resistance of given wire using Ohm’s law, we require the following apparatus.
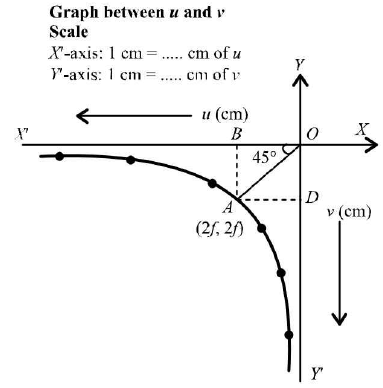
A resistance wire, a voltmeter and an ammeter of appropriate range, battery, a rheostat, a one way key and connecting wires. The circuit diagram is shown below.
- Principle: It states that the physical conditions (temperature, V‘ mechanical strain etc) remaining unchanged, the current ^ flowing through a conductor is always y' directly proportional o the y' potential difference across its two ends.
Mathematically, V∝ I or V=R1 where R is a constant of proportionality called resistance V , l of the conductor. The unit of resistance is volt per ampere or ohm (Ω).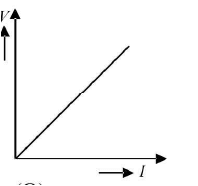
- Its value depends upon the nature of the conductor, its dimensions and the physical conditions.
- While making connections, ensure that positive marked terminals of ammeter and voltmeter are joined towards the positive terminal of the battery.
The sample graph of V vs I is shown below.
13. Potentiometer
(i) Comparison of emf of two primary cells
(ii) Internal resistance of a cell
It is an electrical instrument by which we compare e.m.fs of two cells and can determine the internal resistance of a cell.
- Principle of potentiometer: The working of potentiometer is based on the fact that voltage drop (V) across any section of the potentiometer wire is directly proportional to the length (l) of that section provided the wire is of uniform area of cross-section (A) and a constant current (I) is flowing through it. i.e. V ∝ l or V = kl where k is proportionality constant, it is called the potential gradient along the potentiometer wire.
- Comparison of e.m.f.’s of two cells
For comparison of emf’s of two cells using potentiometer, the circuit arrangement used is shown below.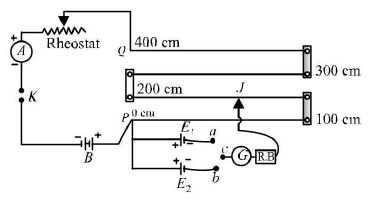
- With the help of a voltmeter we can measure only the terminal potential difference of a cell, but using a potentiometer we can determine the value of e.m.f. (electromotive force) of a given cell. The e.m.f of the auxiliary battery B is constant and more than that of given cell. Insert the key K. A constant current I flows through the potentiometer wire PQ and a potential gradient k = lσ is set up, where a is the resistance per unit length of the potentiometer wire.
The positive terminals of the cells, E1 and E2 are connected to the zero end terminal P of the potentiometer, whereas the negative terminals are connected through a two-way key to a galvanometer, a resistance box and a jockey. When the cell E1 is in circuit, on sliding the jockey gently along the potentiometer wire PQ a point J, say at a distance l, from the zero end, is obtained where the galvanometer shows no deflection. In such a case the -ve terminal of the cell E1 and the point J o n the potentiometer wire are at the same potential. The zero end of the potentiometer wire and the +ve terminal of cell E1 are also at the same potential. Hence, fall of potential along the length lt of the potentiometer wire is equal to the e.m.f. of the cell E1 as no current is being drawn from the cell. As the fall of potential along a wire of a uniform area of cross-section is proportional to its length. E1∝ l1 or E1 = kl1 , ...(i)
where, k is the potential gradient along the wire PQ.
- Similarly, a point at a distance l2, from the zero end of the wire PQ can be obtained with the cell E2, where the galvanometer shows no deflection, so that again
(ii) Dividing equation (i) by (ii), we get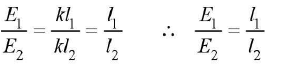
- Internal resistance of a cell
Circuit in figure shows a cell of e.m.f. E and internal resistance r, connected to an external resistance R. The circuit has total resistance (R + r) and current I in circuit is given by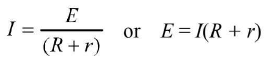
The potential difference of cell V
= P.D. between A and D = E Ir
= P.D. between B and C = IR
Hence, V= E - Ir = IR
(V is less than E, by the amount equal to fall of potential inside the cell due to its internal resistance)
From above Ir = E —V and IR = V
Dividing,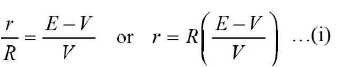
- This equation relates E, V and r in a circuit of external resistance R.
- Determination of internal resistance using a potentiometer For determination of internal resistance of a cell by a potentiometer, the circuit arrangement used is shown in figure below.
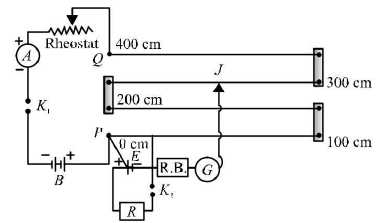
E is the cell whose internal resistance is to be measured. By adjusting the rheostat and closing key K1 if lx is the length of the potentiometer wire to the point where a balance point is obtained in an open circuit i.e., K2 is open, then E = kl1 where, k is the potential gradient along the potentiometer wire.
If the balance point is obtained at l2 when the cell sends a current through shunted resistance R when K2 is also closed, then potential difference between the terminals of the cell
V=kl2
Putting the values of E and Fin eqn. (i),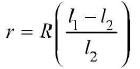
14. Resistance and figure of merit of a galvanometer by half deflection method
- A galvanometer is a device used for detecting feeble electric currents in a circuit. It has a coil suspended between concave poles faces of a strong laminated horse shoe magnet. When an electric current passes through the coil it deflects and the deflection is noted by attached a pointer to the coil. The deflection is directly proportional to the current passed.
The circuit diagram for finding the resistance of a galvanometer by half deflection method is shown below.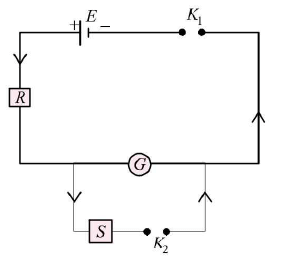
The resistance of galvanometer as found by half deflection method is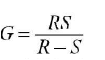 where R is the resistance connected in series with the galvanometer and S is the shunt resistance.
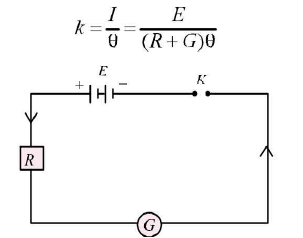
 - Figure of merit of a galvanometer: It is defined as the current required to produce deflection of one division in the scale of galvanometer. Its symbol is k.
When current I produces a deflection 0 in the galvanometer, then figure of merit is given by
If n is the number of divisions in the galvanometer scale, then current required to produce full scale deflection is given by Ig = nk
15. Focal length of
(i) convex mirror, (ii) concave mirror, (iiii) convex lens
- To find the value of v for different values of u in case of a concave mirror and to find its focal length by plotting graph between u and v.
To perform the experiment, we require an optical bench with three uprights (zero end upright fixed, two outer uprights with lateral movement), concave mirror, a mirror holder, two optical needles (one thin, one thick), a knitting needle and a half metre scale.
The following ray-diagram explains the essence of this experiment.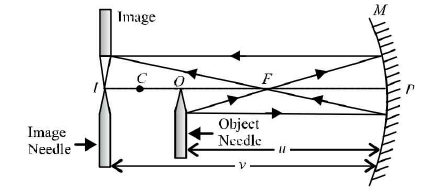
Formula used
From mirror formula, 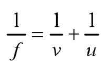
We have, f = 
where,f = focal length o f concave mirror
u = distance of object needle from pole of the mirror
v = distance of image needle from pole of the mirror.
Note: According to sign-convention u and v have negative values. Hence / comes negative.
To determine the rough focal length of the mirror, the image of a far off tree or a building is taken on a wall. The distance between mirror and wall gives us a rough idea of the focal length of the mirror.
Then set the object needle at 1.5 times the f distance. An inverted and enlarged image of the needle will be seen. The other needle (image needle) is used to locate the exact position of the image. We displace the image needle till the tip of the image coincide with it. Read off u and v. Change u and read corresponding v for various observations.
Then plot a graph between u and v.
- Calculations of focal length using graph u-v Graph: Select a suitable but the same scale to represent u along X'-axis and v along T'-axis. According to sign conventions, in this case u and v both are negative. Plot the various points for different sets of values of u and v from the observation table. The graph comes out to be a rectangular hyperbola as shown in figure below.
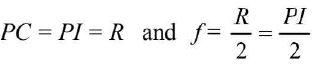
Hence, u = v = R = 2f
Explanation
From mirror formula applied to point A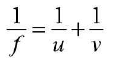
As u = v
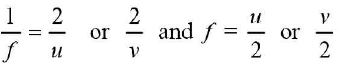
Hence, half the values of either coordinate of A (i.e., distance OD or OB) gives the focal length of the concave mirror.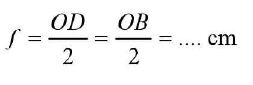
- To find the focal length of a convex mirror using a convex lens.
To perform the experiment, we require an optical bench with four uprights (two fixed uprights in middle, two outer uprights with lateral movement), convex lens (20 cm focal length), convex mirror, a lens holder, a mirror holder, two optical needles, (one thin, one thick) a knitting needle, and a half metre scale.
The following ray-diagram explains the essence of this experiment.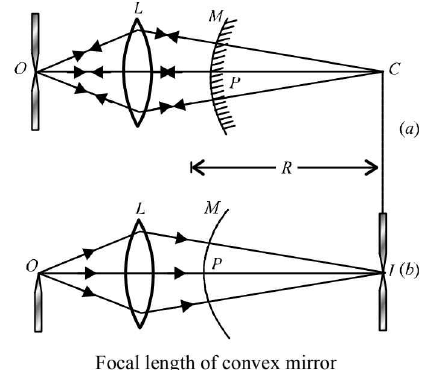
- As a convex mirror always forms a virtual image, its focal length can not be found directly as for a concave mirror. For this purpose, indirect method is used, as described below. An auxiliary convex lens L is introduced between the convex mirror M and object needle O as shown in figure (a). Keeping the object needle at distance about 1.5 times rough focal length of convex lens, the position of convex mirror behind convex lens is so adjusted that a real and inverted image of object needle O, is formed at O itself. Under such condition, the light rays are incident normally over the convex mirror to retrace their path. In the absence of convex mirror, these rays would have met at centre of curvature C of the convex mirror. The distance PC gives the radius of curvature R of the mirror.
To locate the position of C, convex mirror is removed (without disturbing the object needle O and convex lens L). An image needle I is put behind the convex lens and moved to a position at which there is no parallax between tip of inverted image of O needle and tip of I needle. Position of image needle / gives position of centre of curvature C of mirror M. (See figure above).
Then,
- To find the focal length of a convex lens by plotting graph between u and v.To perform the experiment, we require an optical bench with three uprights (central upright fixed, two outer uprights with lateral movement), a convex lens with lens holder, two optical needles, (one thin, one thick) a knitting needle and a half metre scale.
The following ray diagram explains the essence of this experiment.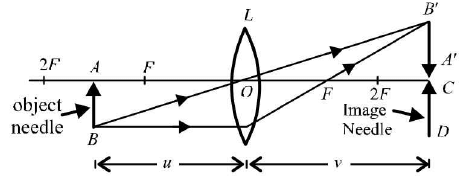
Formula used The relation between u, v and f for a convex lens is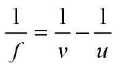
- where,f = focal length of convex lens u = distance of object needle from optical centre of the lens v = distance of image needle from optical centre of the lens.
Note: According to sign-convention, u has negative value and v has positive value. Hence, f comes positive.
Calculation of focal length by using graph.
u-v Graph: Select a suitable but the same scale to represent u along X'- axis and v along 7- axis. According to sign conventions, in this case, u is negative and v is positive. Plot the various points for different sets of values of u and v from observation table. The graph comes out to be a rectangular hyperbola as shown in figure below.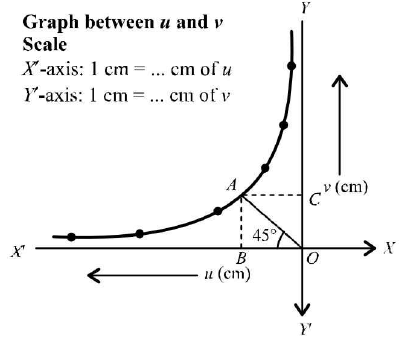
When viewed from the other face the pins are along a particular line. We place pins P} and P4 in line with the images of P, and P2 as seen in the prism. Thereafter line P4PA is drawn which represents the emergent ray. Lift the prism and make the dotted lines and discover the angle of deviation here. This angle can be measured by a protractor. Several such observations for angle of incidence ranging from 30° to 60° can be made and the corresponding angle of deviation can be measured. Plot a graph between D vs i.
A sample graph is drawn below.
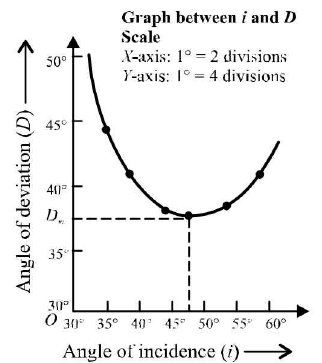
From the graph the minimum value of deviation can be obtained. Angle A can be measured by the protractor from the outline of the prism.To get refractive index of the material of the prism, prism formula is used as follows.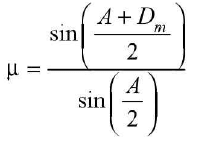
17. Refractive index of a glass slab using a travelling microscope
- Real and apparent thickness of glass slab
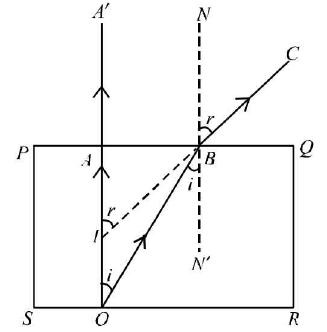 O is the point object at the bottom of glass slab PQRS. A ray of light is incident on PQ ,normally along OA passes straight along OAA'. Another ray o f light from O at the bottom of slab incident at <i on PQ, along OB deviates away from normal. It is refracted at <r along BC. On producing back, BC meets OA at I.
 - Therefore, I is virtual image of O.
The apparent thickness = AI Real thickness = OA
∠AOB = ∠OBN' = i (alternate interior ∠s),
∠A1B = ∠NBC = r (corresponding ∠s )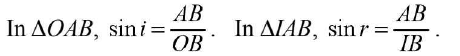
As light is travelling from denser to rarer medium.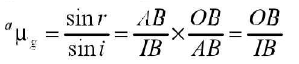
When angles are small, B is close to A.
To determine refractive index of a glass slab, using a travelling microscope, the required apparatus is three glass slabs of different thickness but same material, a travelling microscope, lycopodium powder.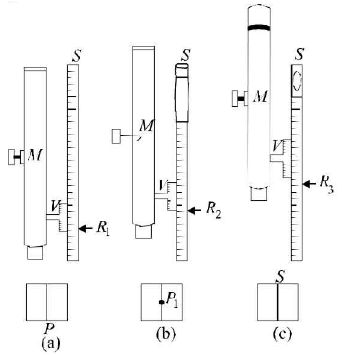
Reading on vertical scale when microscope is focussed on cross mark without slab = Rt cm, cross mark with slab = R2 cm and lycopodium powder = R3cm.
Real thickness = (R2 - Rt) cm
Apparent thickness = (R3 - R2) cm
Refractive index u =
18. Characteristic curves of p-n junction diode in forward and reverse bias
- Forward bias characteristics: To draw characteristic curves o f p-n junction diode in forward bias following circuit diagram is required.
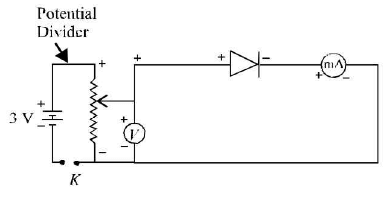
- Forward bias on junction: It produces forward current. With increase in bias voltage, the forward current increases slowly in the beginning and then rapidly. At about 2.4 V, the current increases suddenly. The bias is at once made zero to avoid damage to the diode.
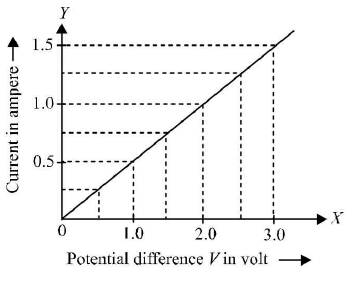
Calculations: Plot a graph between forward bias voltage VF and forward current IF taking VF along X-axis and IF along 7-axis.A sample graph is shown below.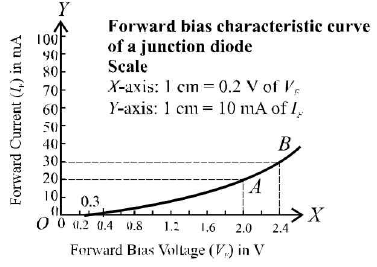
This graph is called forwards bias characteristic curve of a junction diode. - Reverse bias characteristics: For this characteristics the following circuit diagram required.
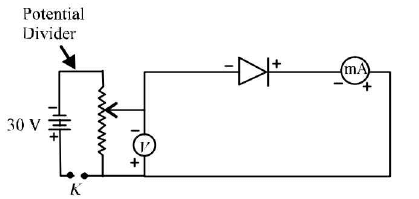
- Reverse bias on junction: In the beginning no appreciable reverse current flows. At about 5 V a feeble current starts flowing. With increase in bias voltage, the current slowly increases. At about 25 V the reverse current increase suddenly. Again the bias is made zero to avoid damage.
Calculations Plot a graph between reverse bias voltage VR and reverse current IR taking VR along X-axis and IR along 7-axis. A sample graph is shown below.
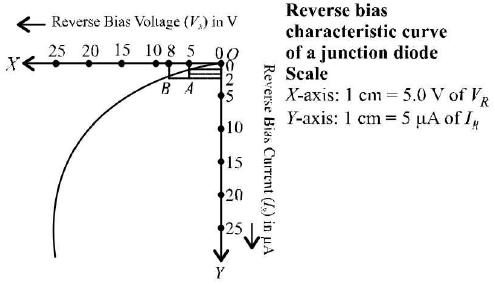
This graph is called reverse bias characteristic curve of a junction diode. In the first graph, for change from point A to B
ΔVf = 2.4 - 2.0 = 0.4 V, ΔIF = 30 - 20 = 10
mA Hence junction resistance for forward bias,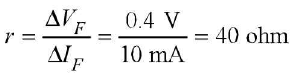
In the second graph, for change from point
A to B ΔVr = 8.0 - 5.0 = 3 V, ΔIr = 2 - 1 = 1μA
Hence junction resistance for reverse bias,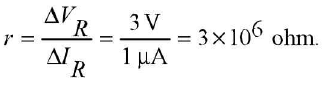
19. Characteristic curves of a Zener diode and finding reverse break down voltage
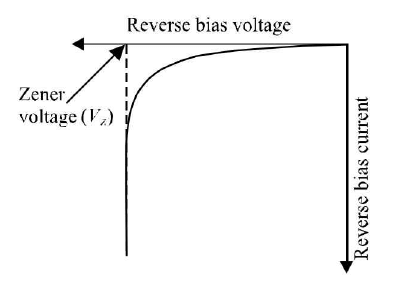
- Zener diode: It is a specially designed junction diode which can operate continuously without being damaged in the region of reverse breakdown voltage. It is used as a voltage regulator.
- Zener breakdown: When the junction diode is reverse biased, free charge carriers are attracted away, (in reverse direction) from junction. As the carriers do not cross the junction, no current flows in external circuit.
- As the bias voltage is increased, covalent bonds between atoms break, setting more electrons and holes free in each section. The free holes in n-type section and free electrons inpty pe section , are called minority carriers.
- The reverse bias makes these minority carriers move towards junction and cross it. Thus a current flows through junction and in opposite direction. The current is very small.
- At a certain reverse bias voltage a breakdown takes place and the current rises suddenly. The breakdown is called Zener breakdown and the voltage is called Zener voltage (Vz) as shown in figure. There is a large change in diode current for a small change in diode voltage.
- Characteristics of Zener diode
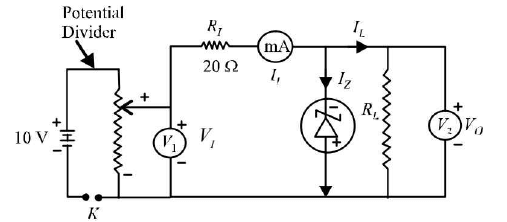
Circuit parameters : In the circuit as shown in the figure,
Vj = Input (reverse bias) voltage
V0 = Output voltage (/?,//,)
Rt = Input resistance
Rl = Load resistance 7; = Input current (reverse current)
Iz = Zener diode current
IL = Load current Relations-(i) V0 = V r RJ, ...(H) V0 = r lIl -(iii) Initially as L; is increased, 7; increases a little, then L0 increases.
At breakdown, increase o f L, increases 7; by large amount, so that Va = V I - R becomes constant.
This constant value of L0 which is the reverse breakdown voltage is called Zener voltage.
Calculations Note : A graph between Vr and 7; will give reverse bias characteristic of the Zener diode. Plot a graph between in put voltage L;and output voltage V0, taking L;along.Y- axis and F0along L-axis. The graph comes as shown below. Since V0 becomes constant at 6 volt the reverse breakdown voltage (Zener voltage) of Zener diode is 6 volt.
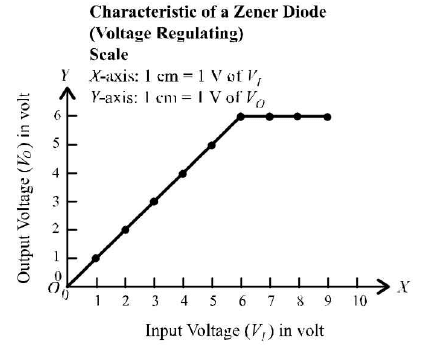
The reverse breakdown voltage of a given Zener diode is 6 volt. 20. Characteristic curves of a transistor and finding current gain and voltage gain
Graph drawn between bias voltage and current in the circuit, are called characteristics of the transistor. They show the way of behaviour of the transistor.
There are two types of characteristics
(i) Input characteristics
(ii) Output characteristicsInput characteristics: In common base circuit (circuit in which base is common between input section and output section) these are obtained by plotting graphs between emitter voltage (VE) and emitter current (IE) for different constant collector voltage ( Vc).
In common emitter circuit (circuit in which emitter is common between input and output section) the input characteristics are obtained by plotting graphs between base voltage. (VB) and base current (IB) for different constant collector voltage (Vc).Output characteristics: In common base circuit, these are obtained by plotting graphs between collector voltage (Vc) and the collector current (IC) for different constant emitter current (IE).
In common emitter circuit, these are obtained by plotting graphs between collector voltage (Vc) and the collector current (Ic) for different constant base current (IB). Current gain and voltage gain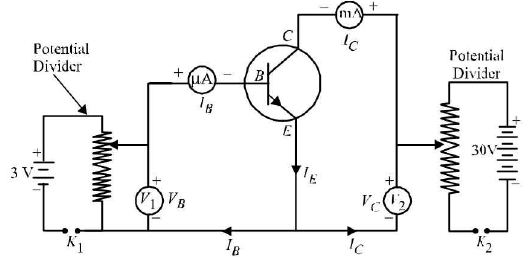
In common emitter circuit of a transistor, emitter base make input section and emitter collector make output section. As usual, base junction (input junction) is forward biased and collector junction (output junction) is reverse biased.
Resistance offered by base junction, is called input resistance (R1). It has a very small resistance due to forward biasing.
Resistance offered by collector junction, is called output resistance (R0). It has a high value due to reverse biasing.
Due to high output resistance (resistance in output section), a high resistance can be used as load resistance (Rt). Generally RL = R0.
The ratio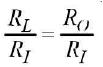 measured resistance gain of the common emitter transistor. It is of Rj Rr the order of one thousand.
Also emitter current (IE) divides itself into base current (IB) and collector current (7f). In n-p-n transistor, Ic is about 98% of IE, base current IB remains only 2% of IE. A little change in IB causes a large change in 7r The ratio of change in collector current to the corresponding change in base current, measures current gain in common emitter transistor.
It is represented by symbol p. i.e.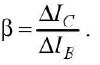
Input resistance,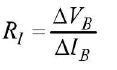
Output resistance,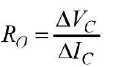
Resistance gain,
Current gain,
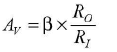
Voltage gain = Current gain x Resistance gain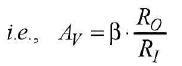
Calculations
Calculation for input resistance (RJ : Plot a graph between base voltage VB and base current IB for zero collector voltage Vc, taking VB along the X-axis and IB along the 7-axis. Plot graphs for different values of V( . The graphs comes as shown in figure below.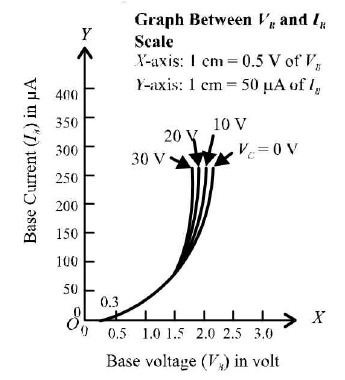
These graphs are called input characteristics of a common emitter transistor.
The slope of graphs become large at the ends. The slope gives value of Its reciprocal
  gives input resistance Rr As graphs run parallel near the ends, all give same value AIb of Rr Calculation for output resistance (RJ : Plot a graph between collector voltage Vc and collector current Ic for 100 pA base current IB taking Vc along X-axis and Ic along 7-axis.
Plot graphs for different values of IB. The graphs come as shown in figure below.
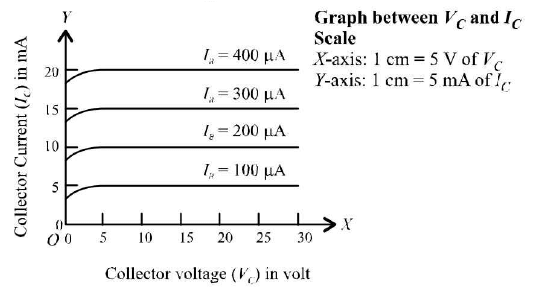
These graphs are called output characteristics of a common emitter transistor.
The slope of graphs becomes almost zero at ends. The slope gives values of 
Its reciprocal 
gives output resistance R0. As graphs run parallel near the ends, all give Alc same value of R0.
Calculation for current gain (β)
Plot a graph between base current 1B and corresponding collector current Ic for 30 volt collector voltage Vc, taking IB along the X-axis and Ic along the 7-axis.
The graph comes to be a straight line as shown in figure below.
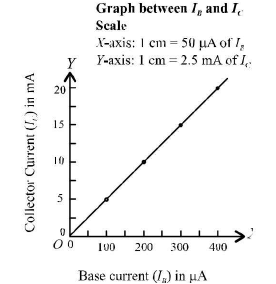
The graph is called current gain characteristic of the common emitter transistor .
The slope of the straight line gives value of  which is the value of current gain (βof
the common emitter transistor.
Calculation of voltage gain (AV)
Voltage gain = current gain x resistance gain
21. Identification of diode, LED, Transistor, IC, Resistor, Capacitor from mixed collection of such items For identification, appeareance and working of each item will have to be considered.
1. A diode is a two terminal device. It conducts when forward biased and does not conduct when reverse biased. It does not emit light while conducting.
2. A LED (light emitting diode) is also a two terminal device. It also conducts when forward biased and does not conduct when reverse biased. It emits light while conducting.
3. A transistor is a three terminal device. The terminals represent emitter E, base B and collector C.
4. An IC (integral circuit) is a multiterminal device in form a chip.
5. A resistor is a two terminal device. It conducts when either forward biased or reverse biased. (Infact there is no forward or reverse bias for a resistor). It conducts even when operated with A.C. voltage.
6. A capacitor is also a two terminal device. It does not conduct when either forward biased or reverse biased. Hence it does not conduct with D.C. voltage. However it conducts with A.C. voltage.
22. Using multimeter to
(i) Identify base of a transistor
(ii) Distinguish between npn and pnp type transistor
(iii) See the unidirectional flow of current in case of a diode and an LED
(iv) Check the correctness or otherwise of a given electronic component (diode, transistor or IC).
In the following table,
(i) V3>V2>V1
(ii) E = emitter, B = base, C = collector Table showing arrangement of leads in different types of transistors, their biasing and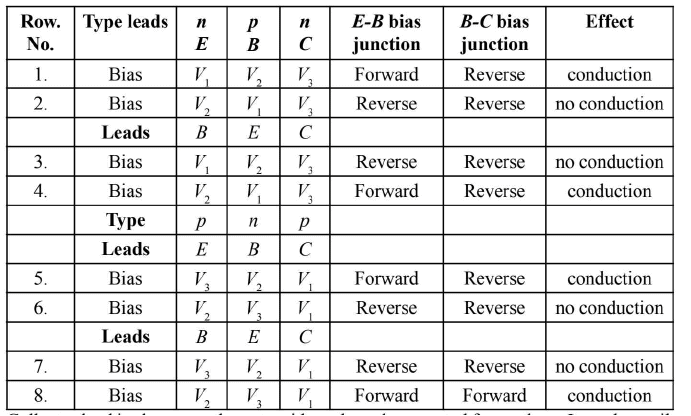
Collector lead is always on the outer side and much separated from others. It can be easily identified.
Hence, base lead is to be identified from between other two close leads.
The multimeter is put in series with the circuit. For this purpose, the common lead i.e.-ve or black of the multimeter is taken to be as + ve and terminal marked (P) is taken as -ve. (It is so because the multimeter battery has its positive connected to common and negative connected to P). The knob is kept at D.C. milli-ammeter range for knowing conduction (movement of pointer) and no conduction (on movement of pointer) conditions of the circuit.
Step : The collector lead (C) is given highest potential Vy The other two leads are given potentials Vl and V2 alternately (rows no. 1 and 2).
If there is no conduction in either case, the collector is positive and the transistor is p-n-p type. The collector is forward biased.
If there is conduction in one of the above two cases, the collector is negative and the transistor is n-p-n type. The collector is reverse biased.
In case of conduction (for n-p-n type), the lead having higher potential (V2) is base, because it makes emitter forward biased. For conditions of row no. 1, central lead is base. For conditions of row no. 4, the outer lead is base.
Step 2: The collector lead (C) is given lowest positive potential Vy The other two leads are given potentials V2 and V1 alternately (rows no.5 and 6).
If there is no conduction in either case, the collector is negative and the transistor is n-p-n type. The collector is forward biased.
If there is conduction in one of the above two cases, the collector is positive and the transistor is p-n-p type. The collector is reverse biased.
In case of conduction (for p-n-p type) the lead having potential (V2) is base because it makes emitter forward biased. For conditions of row no. 5, central lead is base. For conditions of row no. 8, the outer lead is base.
- To see the unidirectional flow of current in case of a diode and an LED.
- Turn the multimeter knob to D C current of range 50 mA. Connect the multimeter in series with the diode circuit. When the diodes (ordinary diode or LED) are forward biased, multimeter pointer moves to indicate flow of current in the circuits. When bias is reversed, there is no current and multimeter pointer remains at zero.


shortcuts and tricks
,Semester Notes
,Objective type Questions
,mock tests for examination
,Exam
,video lectures
,Extra Questions
,Chapter - 23 Practical Physics - JEE
,Chapter - 23 Practical Physics - JEE
,Sample Paper
,Viva Questions
,Previous Year Questions with Solutions
,past year papers
,Free
,Important questions
,Chapter - 23 Practical Physics - JEE
,practice quizzes
,Summary
,MCQs
,ppt
,study material
;


Chapter - 23 Practical Physics Free PDF Download
Importance of Chapter - 23 Practical Physics
Chapter - 23 Practical Physics Notes
Chapter - 23 Practical Physics JEE Questions
Study Chapter - 23 Practical Physics on the App
|
© EduRev
|
Education Revolution
|


|


