Data Interpretation - SSC CGL Tier 2 - Study Material, Online Tests, Previous

Introduction

Data Interpretation (DI) is the part of a quantitative test that requires candidates to read, interpret and analyse information presented in organised forms such as tables, charts and graphs. Questions are set so that candidates must extract relevant values, perform calculations (percentage, ratio, averages, growth, etc.) and draw conclusions. DI problems may look lengthy; the key is to identify the required data, ignore distracting or unnecessary values, and work in a stepwise manner.

How to solve Data Interpretation questions

  • Read the question carefully and identify exactly what is asked before performing any calculation.
  • Scan the figure or table first to locate the rows/columns or segments that contain the required values.
  • Watch for unnecessary or distracting data in the chart or table; do not use it unless the question requires it.
  • Check units (thousand, lakh, percentage, decimals). Convert to a common unit when needed.
  • Check whether values are absolute numbers, percentages, or rates - use the appropriate formula.
  • Round numbers only for quick estimation; keep exact values for final calculation unless approximation is allowed.
  • Use arithmetic shortcuts: percentages → fractions, ratio simplification, proportional scaling, and cancellation wherever possible.
  • Whenever possible, compute totals and store them at the side (for tabular data find row and column totals).
  • Answer the easier sub-questions first; use those results to solve harder parts.

Types of Data Interpretation questions

  • Tabular (tables showing values over categories and periods)
  • Bar charts and column charts
  • Line graphs (trend over time)
  • Pie charts (percentage share of a whole)
  • Mixed graphs (combination of bars and lines or bars and pie segments)
  • Caselet or passage-based DI (short passage containing numeric data)
  • Venn diagrams and simple set-based data interpretation

Key concepts and formulas

  • Percentage: percentage of A w.r.t B = A × 100 / B
  • Change (increase / decrease): New = Original × (1 ± p/100)
  • Ratio: A:B = A ÷ B (simplify by common factor)
  • Averages: Average = Sum of values ÷ Number of values
  • Proportion: If A is p% of B, then A = B × p/100
  • Combined totals: Add or subtract components carefully; check double counting in mixed charts
  • Conversion: thousand, lakh or crore → convert to the same base before comparison

Strategies and shortcuts

  • Calculate row and column totals in tabular DI first; keep these totals visible for quick reference.
  • Convert percentages into fractions when they simplify calculations (for example, 25% = 1/4).
  • For ratio questions, reduce both numerator and denominator by the greatest common divisor early.
  • Use estimation for checking plausibility of options (e.g., if an option is 500% higher it is unlikely when totals double).
  • Use unitary method for translating per-unit values to totals or vice versa.
  • Where possible, compute values for each year/category and mark values that satisfy conditions to avoid recounting.

Example 1

Number of Employees of various departments of Parle India for the year 2011 to 2017 is given. Answer the questions based on the data provided.

Example 1

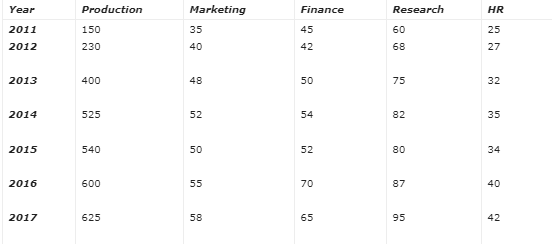
1. In which year the number of employees was 140% more than the no. of employees in 2011.

(a) 2013

(b) 2014

(c) 2015

(d) 2016

The correct answer is option (c).

Solution: Compute the total number of employees in 2011 and then find the value which is 140% more than that.
Total employees in 2011 = 315
140% more means New = Original × (1 + 140/100)
New = 315 × (1 + 1.40)
New = 315 × 2.40
New = 756
Find which year has total = 756. The year with 756 employees is 2015.

2. In how many years, the number of employees in the production department is more than 50 % of total employees?
(a) 2

(b) 5

(c) 4

(d) 6

The correct answer is option (d).

Solution:

Calculate the percentage share of the production department in each year and count years where share > 50%.

In 2011: production = 150; total = 315

Percentage = 150 × 100 / 315 = 47.62%

In 2012: production = 230; total = 407

Percentage = 230 × 100 / 407 ≈ 56.51%

In 2013: production = 400; total = 605

Percentage = 400 × 100 / 605 ≈ 66.11%

In 2014: production = 525; total = 748

Percentage = 525 × 100 / 748 ≈ 70.18%

In 2015: production = 540; total = 756

Percentage = 540 × 100 / 756 ≈ 71.43%

In 2016: production = 600; total = 852

Percentage = 600 × 100 / 852 ≈ 70.42%

In 2017: production = 625; total = 885

Percentage = 625 × 100 / 885 ≈ 70.62%

Except 2011, in all other years the production department share is greater than 50%. Therefore count = 6.

Question for Data Interpretation
Try yourself:Study the following table and answer the questions based on it.   

Example 1

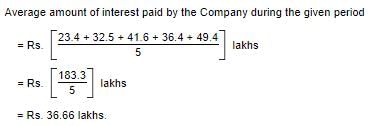
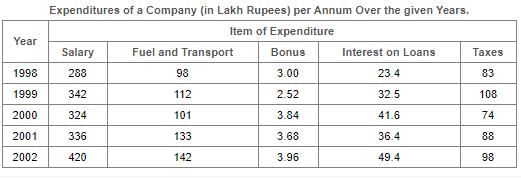
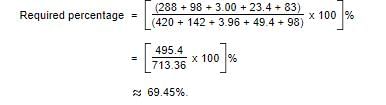
What is the average amount of interest per year which the company had to pay during this period?
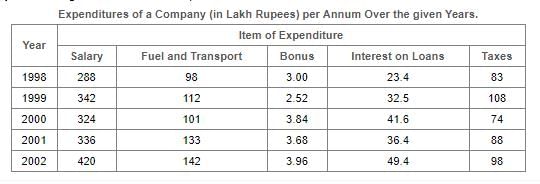
View Solution
Question for Data Interpretation
Try yourself:Total expenditure on all these items in 1998 was approximately what percent of the total expenditure in 2002?

Example 1

View Solution

Example 2

The bar graph given below shows the sales of books (in thousand number) from six branches of a publishing company during two consecutive years 2000 and 2001.

Example 2

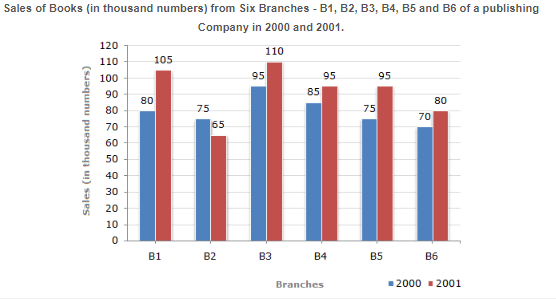
1. What is the ratio of the total sales of branch B2 for both years to the total sales of branch B4 for both years?

(a) 2:3

(b) 3:5

(c) 4:5

(d) 7:9

The correct answer is option (d).

Explanation:Example 2

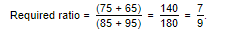
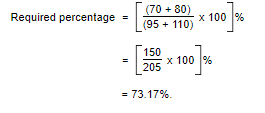
2. Total sales of branch B6 for both the years is what percent of the total sales of branches B3 for both the years?

(a) 68.54%

(b) 71.11%

(c) 73.17%

(d) 75.55%

The correct answer is option (c).

Explanation:

Example 2

Question for Data Interpretation
Try yourself:The ratio of the number of years, in which the foreign exchange reserves are above the average reserves, to those in which the reserves are below the average reserves is?

Example 2

View Solution
Question for Data Interpretation
Try yourself:For which year, the percent increase of foreign exchange reserves over the previous year, is the highest?

Example 2

View Solution

Worked example tips and common checks

  • When a DI question asks for a ratio of totals, compute totals first and then reduce the ratio by their HCF.
  • When a DI question asks for percentage of one total w.r.t another, write the fraction and multiply by 100; cancel factors early to simplify arithmetic.
  • If options are widely spaced, use approximate values to eliminate unlikely choices quickly.
  • Always check whether the question expects an exact decimal, a rounded percentage, or an integer - match the answer format.
  • Recompute any critical arithmetic mentally or on rough work to avoid copying mistakes from the chart to your calculations.

Practice strategy

  • Begin with tabular and single-bar chart questions to build confidence, then move to mixed graphs and caselets.
  • Time yourself: practise completing small sets (4-6 DI questions) within a fixed time to build speed and accuracy.
  • Maintain a notebook of common conversions and frequently used approximations for quick reference.
  • Review incorrect solutions to identify recurring errors (unit mismatch, misreading rows/columns, arithmetic slips).

Final summary

Data Interpretation tests careful reading, selective extraction of data, and correct application of basic arithmetic (percentages, ratios, averages). Use totals and simple formulae, simplify early, and verify units. Regular, timed practice on tabular, bar, line and mixed graphs will build accuracy and speed.

The document Data Interpretation - SSC CGL Tier 2 - Study Material, Online Tests, Previous Year is a part of the SSC CGL Course SSC CGL Tier 2 - Study Material, Online Tests, Previous Year.
All you need of SSC CGL at this link: SSC CGL
1329 videos|1438 docs|835 tests

FAQs on Data Interpretation - SSC CGL Tier 2 - Study Material, Online Tests, Previous Year

1. What is data interpretation?
Ans. Data interpretation is the process of analyzing and making sense of data by examining patterns, relationships, and trends to derive meaningful insights and draw conclusions.
2. Why is data interpretation important?
Ans. Data interpretation is crucial because it helps in making informed decisions, identifying opportunities, and solving complex problems. It allows organizations to uncover hidden patterns and trends in data, which can lead to better strategies and improved performance.
3. What are the steps involved in data interpretation?
Ans. The steps involved in data interpretation include data collection, data cleaning and preprocessing, data analysis, data visualization, and drawing conclusions. These steps help in transforming raw data into meaningful information.
4. How can data interpretation be used in business?
Ans. Data interpretation is widely used in business for various purposes. It can help in market research, customer segmentation, demand forecasting, identifying sales trends, optimizing supply chain operations, and improving overall business performance.
5. What are some common challenges in data interpretation?
Ans. Some common challenges in data interpretation include dealing with large volumes of data, ensuring data quality and accuracy, handling missing or incomplete data, choosing the right data analysis techniques, and effectively communicating the findings to stakeholders.
Related Searches
shortcuts and tricks, ppt, Summary, practice quizzes, Viva Questions, Previous Year, mock tests for examination, Important questions, Sample Paper, Online Tests, Data Interpretation - SSC CGL Tier 2 - Study Material, Data Interpretation - SSC CGL Tier 2 - Study Material, video lectures, past year papers, Extra Questions, Previous Year, Free, pdf , Online Tests, Previous Year Questions with Solutions, Data Interpretation - SSC CGL Tier 2 - Study Material, Online Tests, MCQs, Exam, Semester Notes, Objective type Questions, Previous Year, study material;