Temperature & Pressure Belts of The World | Geography Optional for UPSC PDF Download
The Sun is the primary source of temperature in the atmosphere. However, the atmosphere only receives a small portion of heat energy directly from the Sun, as most of its energy comes from the long-wave radiation emitted by the Earth.
The heating and cooling of the atmosphere are achieved through a combination of direct solar radiation and the transfer of energy from the Earth. This energy transfer occurs through processes such as conduction, convection, and radiation, which help to regulate atmospheric temperature.
Temperature belts of world
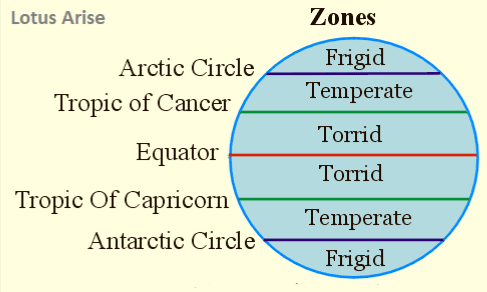
The Earth is divided into three primary heat zones, largely determined by their proximity to the Equator. These zones are:- Temperate Zone: This zone experiences moderate temperatures and is located between the Tropics and the Polar Circles, extending roughly from 23.5 to 66.5 degrees latitude in both the Northern and Southern Hemispheres.
- Torrid Zone: Also known as the Tropical Zone, this region is the hottest and is situated near the Equator, ranging approximately from 23.5 degrees North to 23.5 degrees South latitude.
- Frigid Zone: This is the coldest zone and is situated near the poles, spanning roughly from 66.5 degrees to 90 degrees latitude in both the Northern and Southern Hemispheres.
These heat zones are primarily influenced by the angle at which the sun's rays strike the Earth's surface, with the Torrid Zone receiving the most direct sunlight and the Frigid Zones receiving the least.
 Temperature Belts
- Torrid Zone (Tropical Zone)
The tropical zone, also known as the torrid zone, is the warmest region on Earth. It stretches from the Tropic of Cancer at 23.5°N latitude, across the Equator at 0° latitude, to the Tropic of Capricorn at 23.5°S latitude. Within this zone, the Sun's rays directly reach the Earth's surface at least once a year, resulting in consistently high temperatures. - Temperate Zone
The temperate zones are the Earth's regions with moderate and comfortable climates. There are two temperate zones, one in each hemisphere, located between 23.5° and 66.5° latitude. These areas experience generally mild temperatures and distinct seasons, making them suitable for human habitation. - Frigid Zone
The frigid zones are the coldest regions on Earth, characterized by harsh and freezing temperatures. They are situated to the north of the Arctic Circle at 66.6°N latitude and to the south of the Antarctic Circle at 66.5°S latitude. These areas are perpetually covered in ice, and sunlight is scarce or even nonexistent for extended periods throughout the year.
Importance of the Heat Zones
The importance of heat zones lies in their role in helping us understand climate changes and study weather conditions across the world.Several factors influence temperature patterns on the globe, including:
- Latitude
- Altitude
- Proximity to oceans and seas
- Local wind effects
- Continentality (distance from large water bodies)
- Slope aspect (the direction a slope faces)
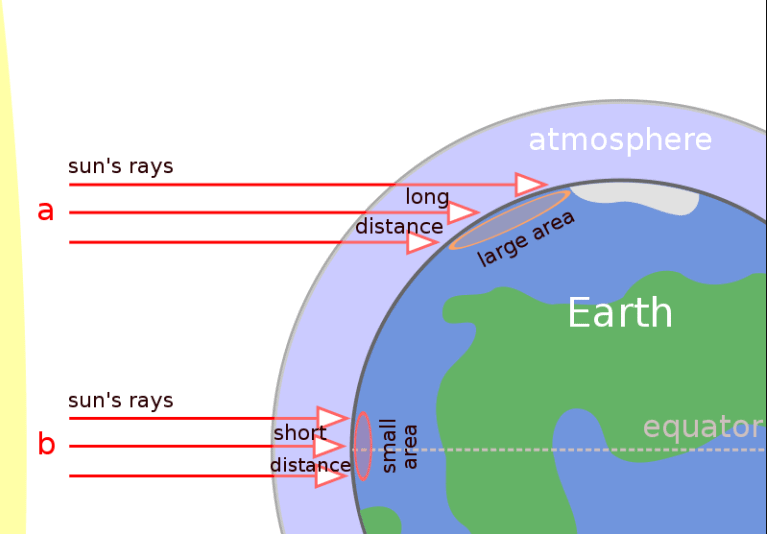
Latitude plays a significant role in temperature distribution across the Earth. Temperatures are generally higher at or near the Equator and decrease as one moves towards the North and South Poles. The reason for this pattern is due to the Earth's curvature, which causes the Sun's rays to strike different parts of the Earth's surface at varying angles. At the Equator, the Sun's rays hit the Earth's surface at a 90° angle (angle of incidence), while the angle decreases as one moves towards the poles. This results in a more concentrated and intense heating effect at the Equator, while the heating effect is more spread out and weaker closer to the poles.
Transparency of Atmosphere
- Aerosols, like smoke and soot, dust, water vapor, and clouds, can impact the transparency of the atmosphere. This is because these particles can interact with radiation in various ways, depending on the size of the particles and the wavelength of the radiation.
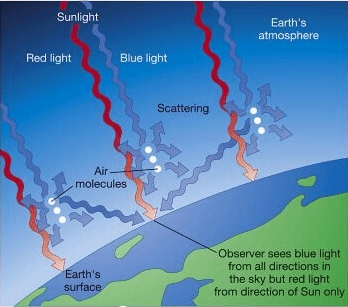
- When the wavelength of radiation is larger than the size of the obstructing particle (e.g., a gas molecule), scattering of radiation occurs. On the other hand, if the wavelength is smaller than the obstructing particle (e.g., a dust particle), total reflection takes place.
- Certain particles, such as water vapor, ozone molecules, carbon dioxide molecules, and clouds, can also absorb solar radiation. This means that these particles capture the energy from the radiation and prevent it from passing through the atmosphere.
- It is important to note that most of the light that reaches the Earth's surface is scattered light, which has been deflected by particles in the atmosphere. This is why the sky appears blue, as shorter blue wavelengths are scattered more easily than longer red wavelengths.
 Scattering by Temperature
Land-Sea Differential
- The albedo, or the reflecting ability, of land is significantly higher than that of oceans and water bodies. This is particularly true for snow-covered areas, which can reflect up to 70%-90% of incoming sunlight (insolation).
- Sunlight is able to penetrate deeper into water, reaching depths of up to 20 meters, compared to land where it only penetrates up to 1 meter. As a result, land experiences more rapid heating and cooling compared to oceans. In the ocean, a continuous convection cycle aids in the exchange of heat between layers, which helps to maintain lower diurnal and annual temperature ranges.
Earth’s Distance form Sun
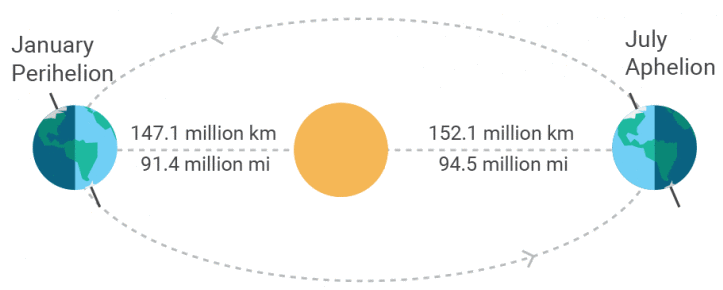
- During its orbit around the sun, the Earth reaches its farthest point from the sun, called aphelion, on July 4th at a distance of 152 million kilometers. Conversely, the Earth is closest to the sun on January 3rd at a distance of 147 million kilometers, which is known as perihelion. As a result, the Earth receives slightly more solar energy, or insolation, on January 3rd compared to July 4th.
- However, this variation in the amount of solar energy received by Earth does not significantly impact daily weather changes on its surface. This is because other factors, such as the distribution of land and sea as well as atmospheric circulation, play a more dominant role in influencing weather patterns. Thus, the difference in solar output between aphelion and perihelion is not a major factor in determining daily weather conditions on Earth.
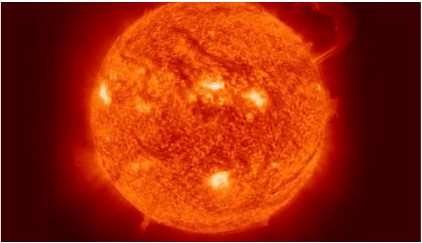
Sunspots are formed on the outer surface of the sun due to periodic disturbances and explosions. These sunspots fluctuate in number from year to year, following an 11-year cycle. As the number of sunspots increases, so does the energy radiated from the sun. Consequently, the amount of solar radiation, or insolation, received by the Earth's surface also increases.
 Sun
Sun
Altitude
- altitude is the height above the sea level
- high altitude (at the mountain), low temperature
- low altitude (on the land surface), high temperature
Reasons
- at the higher altitudes, the amount of atmosphere decreases and as a result, there is less water vapour in the air. the atmosphere absorbs less heat and therefore the temperature at higher altitude drops.
Distance from the Sea
- the difference in heating of land and water affects the temperature of places located near the coast differently from those located inland.
Maritime Influence
- when the sea is cooler than the land in summer, it lowers the temperature of the coastal place. however, during the winter the sea is warmer than the land and keeps coastal places warmer by moderating the winter temperature.
Continental Influence
- located in the interior of large continents or landmasses are under the continental influence, that is, the sea does not an effect on them as they are too far in temperatures. as the land heats up rapidly, inland locations tend to have hotter summers than areas near the coast in similar latitudes.
Ocean Currents
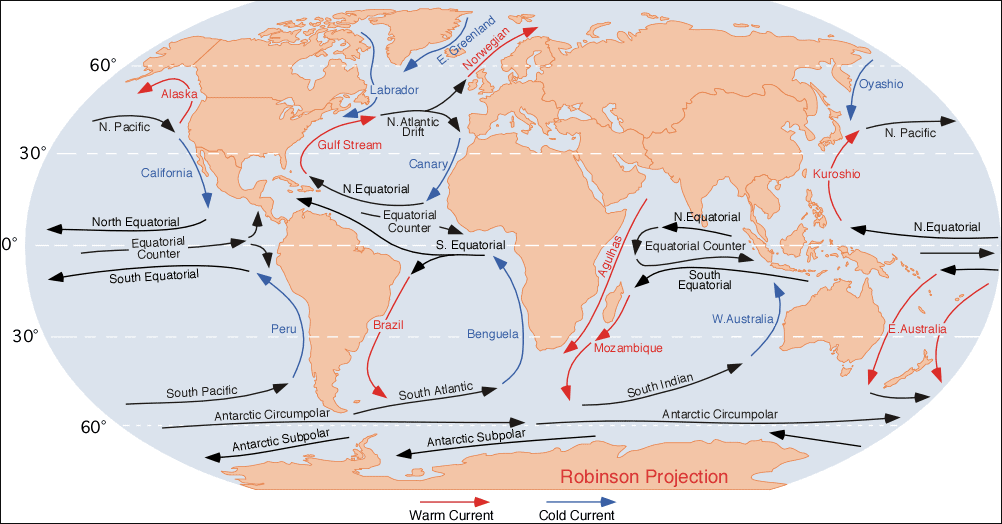
- Ocean currents are vast streams of water that flow through the oceans, created by winds blowing across the water's surface. There are two primary types of ocean currents: cold currents, which transport water from the polar regions, and warm currents, which bring warm water towards the polar regions.
- These ocean currents have a significant impact on the temperature of nearby coastal areas. For instance, coastal regions influenced by warm currents will experience milder temperatures during winter months. On the other hand, if cold currents travel along the coast, they can cause temperatures in the area to drop.
- In summary, ocean currents play a crucial role in regulating temperatures in coastal regions by transporting warm and cold water from different parts of the world.
 Ocean Currents
Types of land surface
- Dense forest– the vegetation prevents solar radiation from reaching the ground directly. The ground remains cool.
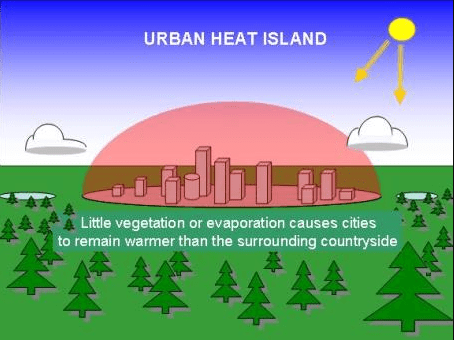
- In the city– the presence of concrete surfaces tends to keep the air temperature high. The concrete surface absorbs heat during the day and retains the heat at night.
 Urban Heat Island
Aspect
- Aspect refers to the orientation of a slope in relation to the sun's position. It determines the amount of sunlight a slope receives, which affects its temperature.
- In tropical regions, aspect is not very significant because the sun is usually high in the sky during mid-day, resulting in relatively uniform solar radiation across all slopes. Thus, the impact of aspect on temperature is minimal in these areas.
- However, in temperate regions, the sun's angle is much lower during winter, causing differences in temperature between slopes that face north and south. In the northern hemisphere, south-facing slopes receive a higher concentration of solar radiation, making them generally warmer than north-facing slopes. This is due to the fact that the sun's rays directly hit the south-facing slopes, resulting in more absorption of sunlight and higher temperatures.
Mean Annual Temperature Distribution
- Isotherm: An imaginary line joining places having equal temperatures.
- The horizontal or latitudinal distribution of temperature is shown with the help of a map with isotherms.
- The effects of altitude are not considered while drawing an isotherm. All the temperatures are reduced to sea levels.
General characteristics of isotherms
- Isotherms generally follow the lines of latitude, which means that they run parallel to each other. This is because locations at the same latitude receive roughly the same amount of sunlight, resulting in similar temperatures.
- However, there can be sudden bends in isotherms at the boundaries between oceans and continents. This is due to the different ways in which land and water absorb and release heat, which causes variations in temperature even at the same latitude.
- When isotherms are closely spaced, it indicates a rapid change in temperature, or a high thermal gradient. On the other hand, when isotherms are widely spaced, it suggests that the temperature change is small or slow, resulting in a low thermal gradient.
General Temperature Distribution
- The highest temperatures are typically found in tropical and subtropical regions due to the high levels of sunlight they receive. In contrast, the lowest temperatures are generally observed in polar and subpolar regions, as well as in continental interiors where the moderating effects of oceans are absent.
- The range of temperatures experienced throughout the day (diurnal range) and the year (annual range) is greatest in the interiors of continents, again due to the absence of the ocean's moderating effects. On the other hand, the diurnal and annual range of temperatures is smallest in oceans, as the high heat capacity of water and its mixing properties help to maintain a more consistent temperature.
- Temperature gradients, or the rate at which temperature changes with distance, are generally low in tropical regions since the sun is nearly overhead all year long, while higher gradients are found in middle and higher latitudes where the sun's path varies significantly throughout the year. Additionally, temperature gradients tend to be low on the eastern edges of continents due to the presence of warm ocean currents, whereas they are high on the western edges where cold ocean currents prevail.
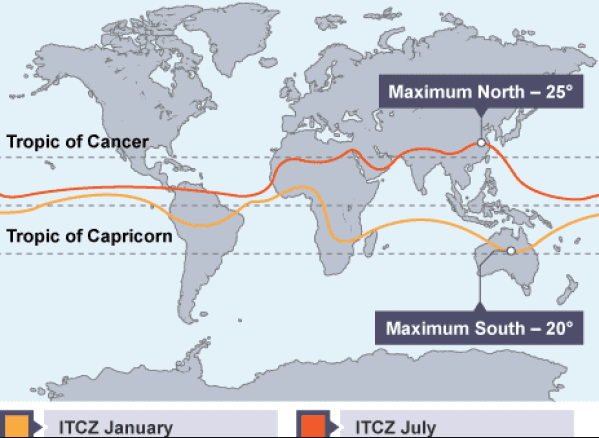
- The distribution of isotherms, or lines of equal temperature, is irregular in the northern hemisphere due to the greater amount of land compared to water. As a result, the northern hemisphere tends to be warmer, and the thermal equator (also known as the Intertropical Convergence Zone or ITCZ) usually lies north of the geographical equator.
- When isotherms pass through areas with warm ocean currents, they tend to shift poleward, as seen with the North Atlantic Drift and Gulf Stream combined with westerlies in the North Atlantic, and the Kurishino Current and North Pacific current combined with westerlies in the North Pacific.
- Moreover, mountains can also influence the horizontal distribution of temperature. For example, the Rocky Mountains and the Andes act as barriers, preventing oceanic influences from extending further inland into North and South America.
Inter Tropical Convergence Zone
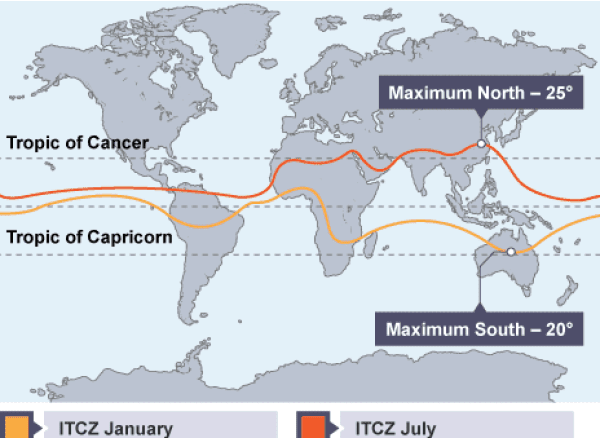
The Inter-Tropical Convergence Zone (ITCZ) is an extensive region of low pressure located near the equator, where the northeast and southeast trade winds come together. This area of convergence generally aligns with the equator but shifts north or south depending on the sun's apparent movement.
 ITCZ
ITCZ
Seasonal Temperature Distribution
- The distribution of global temperatures can be better understood by examining the temperature patterns in January and July. Temperature distribution is typically illustrated on maps using isotherms, which are lines that connect places with the same temperature. Generally, isotherms tend to run parallel to lines of latitude, demonstrating the influence of latitude on temperature. This pattern, however, is more noticeable in July than in January, particularly in the northern hemisphere.
- In the northern hemisphere, there is a larger land surface area compared to the southern hemisphere. As a result, the impacts of landmasses and ocean currents on temperature distribution are more evident in this region. Overall, studying temperature distribution during these two months can provide valuable insights into the global distribution of temperatures and the factors that influence it.
Seasonal Temperature Distribution – January
- During January, it is winter in the northern hemisphere and summer in the southern hemisphere.
- The western margins of continents are warmer than their eastern counterparts since the Westerlies are able to carry high temperature into the landmasses.
- The temperature gradient is close to the eastern margins of continents. The isotherms exhibit a more regular behavior in the southern hemisphere.
Northern Hemisphere
- In the Northern Hemisphere, the isotherms - lines that connect points of equal temperature - show a deviation to the north over the ocean and to the south over the continent. This pattern is particularly noticeable in the North Atlantic Ocean.
- This deviation can be attributed to the presence of warm ocean currents, such as the Gulf Stream and the North Atlantic Drift. These currents make the North Atlantic Ocean warmer, causing the isotherms to shift poleward. This indicates that the oceans are able to carry higher temperatures towards the poles.
- Conversely, an equatorward bend of the isotherms over the northern continents demonstrates that these landmasses are significantly cooler. This is due to the ability of cold polar winds to penetrate southwards, even into the interiors of continents. This effect is especially pronounced in the Siberian plain.
- The lowest temperatures in the Northern Hemisphere are recorded in northern Siberia and Greenland, highlighting the impact of these cooling effects on continental landmasses.
Southern Hemisphere
- The effect of the ocean is well pronounced in the southern hemisphere. Here the isotherms are more or less parallel to the latitudes and the variation in temperature is more gradual than in the northern hemisphere.
- The high-temperature belt runs in the southern hemisphere, somewhere along 30°S latitude.
- The thermal equator lies to the south of the geographical equator (because the Intertropical Convergence Zone or ITCZ has shifted southwards with the apparent southward movement of the sun).
Seasonal Temperature Distribution – July
- During July, it is summer in the northern hemisphere and winter in the southern hemisphere. The isothermal behavior is the opposite of what it is in January.
- In July the isotherms generally run parallel to the latitudes. The equatorial oceans record warmer temperatures, more than 27°C. Over the land more than 30°C is noticed in the subtropical continental region of Asia, along the 30° N latitude.
Northern Hemisphere
- The highest temperature range, exceeding 60°C, can be found in the northeastern part of the Eurasian continent, which is due to the effect of continentality. On the other hand, the smallest temperature range of 3°C occurs between 20° S and 15° N latitudes.
- In the northern continents, isotherms (lines of equal temperature) bend towards the poles, indicating that these landmasses experience high temperatures and the warm tropical winds can penetrate far into the northern regions. In contrast, isotherms over the northern oceans shift towards the equator, suggesting that these oceanic areas are cooler, and they help moderate the temperatures in the tropical regions. The coldest temperatures are typically found over Greenland.
- The belt with the highest temperatures goes through northern Africa, West Asia, northwestern India, and the southeastern United States. The temperature gradient in the northern hemisphere is irregular, with isotherms following a zig-zag pattern.
Southern Hemisphere
- In the Southern Hemisphere, the impact of the ocean on temperature is quite significant. In this region, the lines of equal temperature, or isotherms, tend to run parallel to lines of latitude, resulting in a more gradual change in temperature compared to the Northern Hemisphere.
- A zone of high temperatures can be found around the 30°S latitude in the Southern Hemisphere. Additionally, the thermal equator, or the line marking the area with the highest average temperatures, is located south of the geographical equator. This is due to the southward shift of the Intertropical Convergence Zone (ITCZ), which occurs as the sun appears to move southward.
Vertical Distribution of Temperature
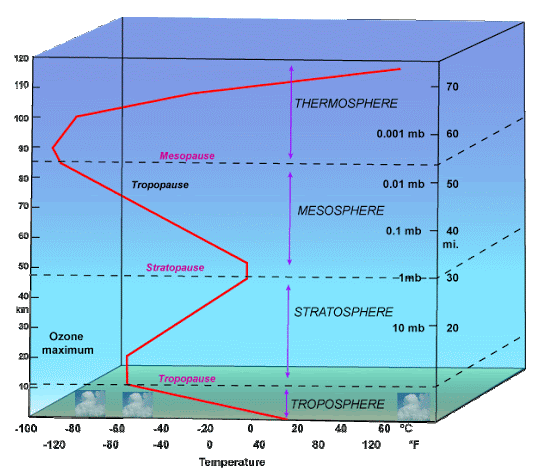
- The normal, lapse rate is uniform at a given level at all altitudes within the troposphere.
- At the Tropopause, the lapse rate stops at zero i.e. there is no change in temperature there.
- In the lower stratosphere, the lapse rate remains constant for some height, while higher temperatures exist over the poles because this layer is closer to earth at the poles.
Temperature Anomaly
- The difference between the mean temperature of a place and the mean temperature of its parallel (latitude) is called the temperature anomaly or thermal anomaly.
- The largest anomalies occur in the northern hemisphere and the smallest in the southern hemisphere.
Mean Thermal Equator
- The thermal equator refers to a global isotherm representing the highest mean annual temperature at each longitude around the planet. It is important to note that the thermal equator does not align exactly with the geographical equator. While the highest absolute temperatures can be found in the Tropics, the highest mean annual temperatures are generally recorded at the equator. However, local temperatures can be significantly impacted by geographical factors such as mountain ranges and ocean currents, leading to deviations in the location of the thermal equator from that of the geographic Equator.
- The Earth's distance from the Sun varies throughout the year, with its closest approach (perihelion) occurring in early January and its farthest point (aphelion) in early July. During the respective hemispheres' winter seasons, the angle at which sunlight reaches the tropics is relatively low, causing the average annual temperature in these regions to be lower than that observed near the equator. This is due to the minimal change in the angle of sunlight at the equator.
- Throughout the year, the thermal equator shifts north and south, following the movement of the Sun's vertical rays. However, on average, the position of the thermal equator is around 5° N latitude. This is because the highest mean annual temperature moves more significantly northward during the summer solstice than it does southward during the winter solstice.
Conclusion
The Earth's temperature distribution is influenced by a variety of factors, including latitude, altitude, proximity to water bodies, and ocean currents. The planet is divided into three primary heat zones, which are the Torrid, Temperate, and Frigid Zones. The transparency of the atmosphere, Earth's distance from the Sun, and the type of land surface also play significant roles in the heating and cooling of the atmosphere. Isotherms are used to illustrate temperature distribution and reveal general patterns, such as the thermal equator, which varies seasonally and deviates from the geographical equator. Understanding these factors and their impact on temperature distribution is crucial for studying climate changes and global weather conditions.Frequently Asked Questions (FAQs) of Temperature & Pressure Belts of The World
What are the three primary heat zones of the Earth?
The three primary heat zones of the Earth are the Torrid Zone (Tropical Zone), the Temperate Zone, and the Frigid Zone. These zones are determined by their proximity to the Equator and are characterized by their distinct temperature ranges and climate conditions.
What factors influence temperature patterns on the globe?
Several factors influence temperature patterns on the globe, including latitude, altitude, proximity to oceans and seas, local wind effects, continentality (distance from large water bodies), and slope aspect (the direction a slope faces).
What is the significance of ocean currents in regulating temperatures?
Ocean currents play a crucial role in regulating temperatures in coastal regions by transporting warm and cold water from different parts of the world. Coastal regions influenced by warm currents will experience milder temperatures during winter months, while those influenced by cold currents can experience cooler temperatures.
What is an isotherm, and what are its general characteristics?
An isotherm is an imaginary line joining places with equal temperatures. Isotherms generally follow the lines of latitude, running parallel to each other. However, they can bend at the boundaries between oceans and continents due to the different heating properties of land and water. When isotherms are closely spaced, it indicates a rapid temperature change, while widely spaced isotherms suggest a slow temperature change.
How does the distribution of temperature vary during different seasons?
During different seasons, the distribution of temperature varies as a result of factors such as the angle of sunlight, proximity to oceans and seas, and the influence of landmasses and ocean currents. For example, during January, the temperature gradient is close to the eastern margins of continents, while in July, the isotherms generally run parallel to the latitudes. These variations in temperature distribution help us understand global temperature patterns throughout the year.
|
303 videos|636 docs|252 tests
|
FAQs on Temperature & Pressure Belts of The World - Geography Optional for UPSC
| 1. What are temperature belts of the world? |  |
| 2. What is the transparency of the atmosphere? |  |
| 3. What is the Inter Tropical Convergence Zone (ITCZ)? |  |
| 4. What is the Mean Thermal Equator? |  |
| 5. Why are FAQs related to temperature and pressure belts important for the UPSC exam? |  |


