Urban Sprawl | Geography Optional for UPSC PDF Download
Sphere of Urban Influence
- Urban centers have inextricable bonding with the surrounding landscape where the socio-economic and cultural influence of the city spreads.
- The radial distance from the physical limits of the city where the city provides goods and services by import of various city manufactured/produced goods and services and also receive supplies of labor resources and economic inputs are said to have functional and economic integration with the city. Such notional surroundings have termed as sphere of urban influence. The term sphere of influence area was first used by Northam and supported by Canter. The urban sphere of influence is the geographical region which surrounds a city and maintains inflow-outflow relationship with the city.
- It is also called Umland by the geographers of Scandinavia and Germany. Umland is a German word which means the area around. The term was first used by the Allies in the Second World War.
- The largest possible sphere of influence is known as city region, where the highest range of goods and services are provided. The term city-region was first used by Dickinson. It is used to describe a similar situation on a much larger scale.
- For ports, similar regions have been called as hinterland.
- Sphere of influence can be defined as the catchment area of the city from where it draws services and various products and also provides the same. (functional integration from surrounding area having two way linkages).
- A city region or urban sphere of influence or Umland has the same meaning and their delimitation is based on the range of goods and services and the demand and supply.
- Every urban centre, irrespective of the size of population and the nature of function, has a region of influence. The intensity of influences decreases with distance from the core of the city. Generally speaking, as the size of the population increases, the multiplicity of functions increases. As a result, the influence zone is larger and vice versa. The influence area of the city may increase by fast communication networks.
- The influence area of the city is proportional to the number of services & volume of services of a city. For example – the area of the influence of Mumbai is larger than Lucknow because Mumbai provides large services than Lucknow.
- The range of goods and services means the optimum distance the economic rational man would travel to obtain goods and services from the city.(E.g. person living in Chennai would get I-phone on Chennai only, but for Supreme Court, he has to go to Delhi).
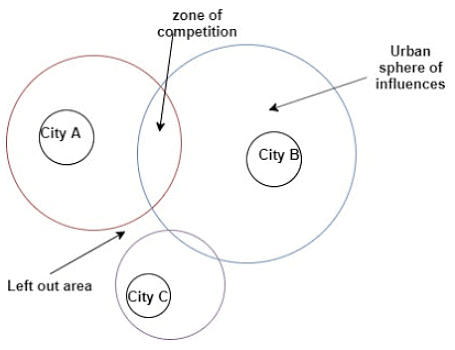 Sphere of Urban Influence
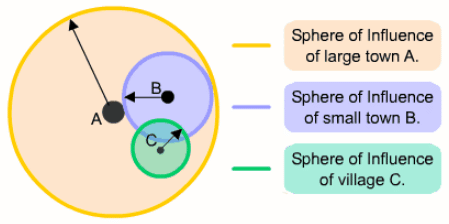 Urban spheres of Influence
- City Influence: City influence is the area where the exclusive influence of city extends without competition. The monopoly of city exists in this area. Generally in terms of lower and medium goods and services, the city influence is determined.
- City regions are identified on the basis of intensity and magnitude of their function. Here distance decay law operates.
- The structure of Urban Sphere of Influence is determined by the centrality of goods and services and their characteristic range where Range = distance and Centrality = demand
- City dominance: City dominance is the region where city competes with other cities but its own economic functions dominate.
- Zone of competition: It is the overlapped area or interface region where two or more cities can provide their goods and services. The determination of the boundaries of the city’s sphere of influence is located in the zone of competition.
- City region: It is largest area of urban sphere of influence. In above diagram AY and BX for A, B respectively. AM and BN are the City Exclusive Regions.
Determination of Urban Sphere of Influence
The urban sphere of influence can be determined by two methods
- Qualitative methods
- Quantitative methods
1. Qualitative methods
- This method is based on empirical observation of primary and secondary data. Primary data is collected data from field surveys and secondary data is collected from agencies and organisations.
- UN Criteria
- For 5000 population town (5000-10000):
- Service provided by primary health centres
- Primary and secondary education
- Post office accounts and services
- Cycle repair
- Bank account holders
- Repairing and purchase of agricultural equipments
- Purchase of cloths
- For 1 lakh plus cities
- Purchase of agricultural equipments. E.g. tractors, machines
- Higher education
- Treatment of lethal disease
- Purchase of costly clothing and ornaments for special occasions.
R L Singh criteria
He was first to study the Umland of any city of India (Varanasi in 1956). He classified two sets of criteria for Varanasi
- Demand based (inflow variables)
(i) Vegetable supply (he concluded 8 km distance for Varanasi)
(ii) Milk supply
(iii) Grain supply - Supply based (outflow variables)
(i) Bus service
(ii) Newspaper distribution
(iii) Administration - He took out the radial distance for each of the goods and services from the centre of city. R L Singh’s study was followed by the study of U Singh, who studied Allahabad (1961) and later KAVAL (Kanpur, Allahabad, Varanasi, Agra, Lucknow) towns (1962).
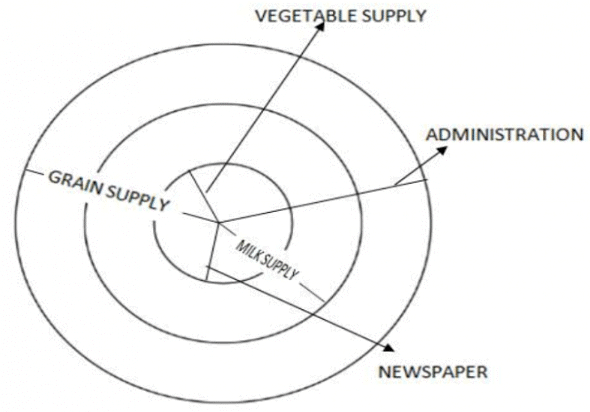 Qualitative Methods
2. Quantitative methods
- Quantitative methods are further classified into geometrical and statistical method
- Geometrical methods: It is also divided into two methods viz. Skyline Method and Proximal Method
- Skyline Method
- In this method the range of goods and services are calculated on the basis of surveys and data, and the boundaries are delimited from various goods and services till the supply point.
- All the irregular polygon areas are superimposed on each other and the outermost overlapping boundaries are taken as the limit of urban sphere of influence.
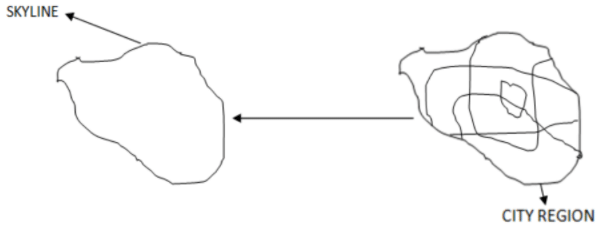 Skyline Method
- Proximal Method
- Urban centres over the same hierarchy are plotted over the map. It is also referred to as Thiessen Polygon method.
- The midpoint of all the cities are connected by straight lines, thus an irregular polygon emerge over a surface which is taken as the boundary limits of the sphere of influence/ city region.

Statistical Model
Most of the quantification for the study of urban field/city region/urban sphere of influence is based on Newton’s law of gravity. Thus, such models have been called Gravity Analogue Models. Several models are based on probability and several models have been constructed based on behavioral matrix analysis (where primary data is collected to quantify the decision of individuals over their choice, demand, and preference).
Breakpoint theory (Gravity Analogue Model)
- In this model there are two cities separated by 18 km distance and population size of 45000 and 5000 respectively. Population is taken as mass and thus law of gravitation is applied to estimate the pull by each of the cities.
 Break Point theory
 - Gravity = Pi*Pj/dij
- This has been further modified to get the break point (point between i and j where pull of i will be effective) between i and j.
- Break Point = dij/√1+ (Pi/Pj)
- In above case the break point for city I will be 4.5 km from J
- The break point law provides linear boundary. Based on this method, the break point for each of surrounding cities are found and connected with straight line.
Law of Retail Trade Gravitation (Gravity Analogue Model)
- This law was proposed by Reilly. It assumes that there is settlement K with population size 1000 located at the distance of 12 km from city I and 6 km from city J.
- The following formula gives the ratio of the volume of trade moving into either city I or J. It can also express the number of people travelling to respective cities for goods and services.
- Mki/Mkj = Pi/Pj*(dkj/dki)² = 40000/5000*(6/12)² = 2:1
- In above equation
- Mki= Mass of people/ volume of trade moving from k to i
- Pi= Population of i
- dik= Distance between i and k.
- In above case we get the ratio of 2:1 which signifies that if two people move from k to i, 1 moves to j.

- This method provides a well defined cut off area of influence. It is hence widely appreciated and is used in developed countries. However, this model is far from reality and hence less applicable.
Probability model by Haff
- This model is based on the law of probability to determine how many people/the volume of trade will move to cities I and J.
- If settlement k is located on the midpoint and the population size is the same, then the ratio will be 50:50.
- If the ratio of distance is 18:6 with the same population then the ratio will be 1:9.
- Similarly, various probabilities can be worked out.
For a city region, linear boundaries can never be drawn. City region can be defined by centrality and range of goods and services which is variable for each of them.
This model failed because human behavior is unpredictable.
Behavioural model
- Since the behavioural model is based on individual analysis at a given point of time, they became very complex and they could not work out in a precise manner the boundary limits of a city region.
- Behavioural model matrix was prepared by Prat who attempted to quantify the behaviour of people through various intrigue.
- Thus, the quantitative methods can’t precisely determine the city region of sphere of influence since
(i) Primary data collected ha number of discrepancies.
(ii) The decision making of people changes with time and circumstances.
(iii) People choices, taste, emotions, values can’t be quantified.
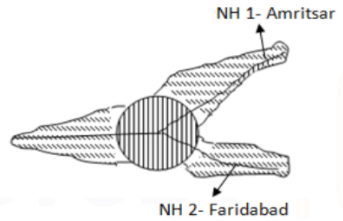
(iv) Man is neither economic nor rational and his behaviour analysis can’t be produced through a law of model, where there is rigidity in areal demarcation. - It was found in many developing countries, cities that influence areas become star shaped. In that situation, there is need to bring some modification to the statistically demarcated area.
- This modification is to be based on empirical method or some variable are to be suitably chosen for the inclusion of those areas which are not coming within influence area through statistical method but functionally they qualify to be a part of influence area. In such circumstances, statistically demarcated area is to be extended where ever it needed. Hence, a new approach should be statistical cum empirical in nature.
- For example NCR is a well defined city region and has used this statistical cum empirical approach. It is due to this empirical approach that demarcated area is projected outside along all important roadways which go outside Delhi. Developed Western countries however, have a different situation with infrastructure developed in all directions and again due to pollution and environment degradation, the settlement growth is not strong along roadside as it is found in developing countries.
- City region is largely a mental construct or abstract notion, and delimitation by quantitative methods is impossible because nature of demand/production at city centre and the population size is dynamic. However, the qualitative method can be used to find near proximity to reality.
 Behavioural Model of Sphere of Urban Influence
|
303 videos|636 docs|252 tests
|
FAQs on Urban Sprawl - Geography Optional for UPSC
| 1. What is urban sprawl? |  |
| 2. How does urban sprawl impact the environment? |  |
| 3. What are the social consequences of urban sprawl? |  |
| 4. How does urban sprawl impact infrastructure and public services? |  |
| 5. What are some strategies to manage urban sprawl? |  |


