What is a Graph?
- A graph is like a picture that shows how one thing changes when another thing changes. In the picture, there is a line that can be straight or curved.
- The line helps us understand the connection between two things.
- In the relationship between these two things, we have one thing that we can change on purpose. This thing is called the independent variable.
- The other thing changes because of this, and it is called the dependent variable. Usually, in the picture, the thing we change on purpose is shown on the horizontal line (left to right), and the other thing is shown on the vertical line (up and down).
- For example, if we want to show a picture of how voltage (the thing we change) affects current (the thing that changes), we put voltage on the left-right line and current on the up-down line.
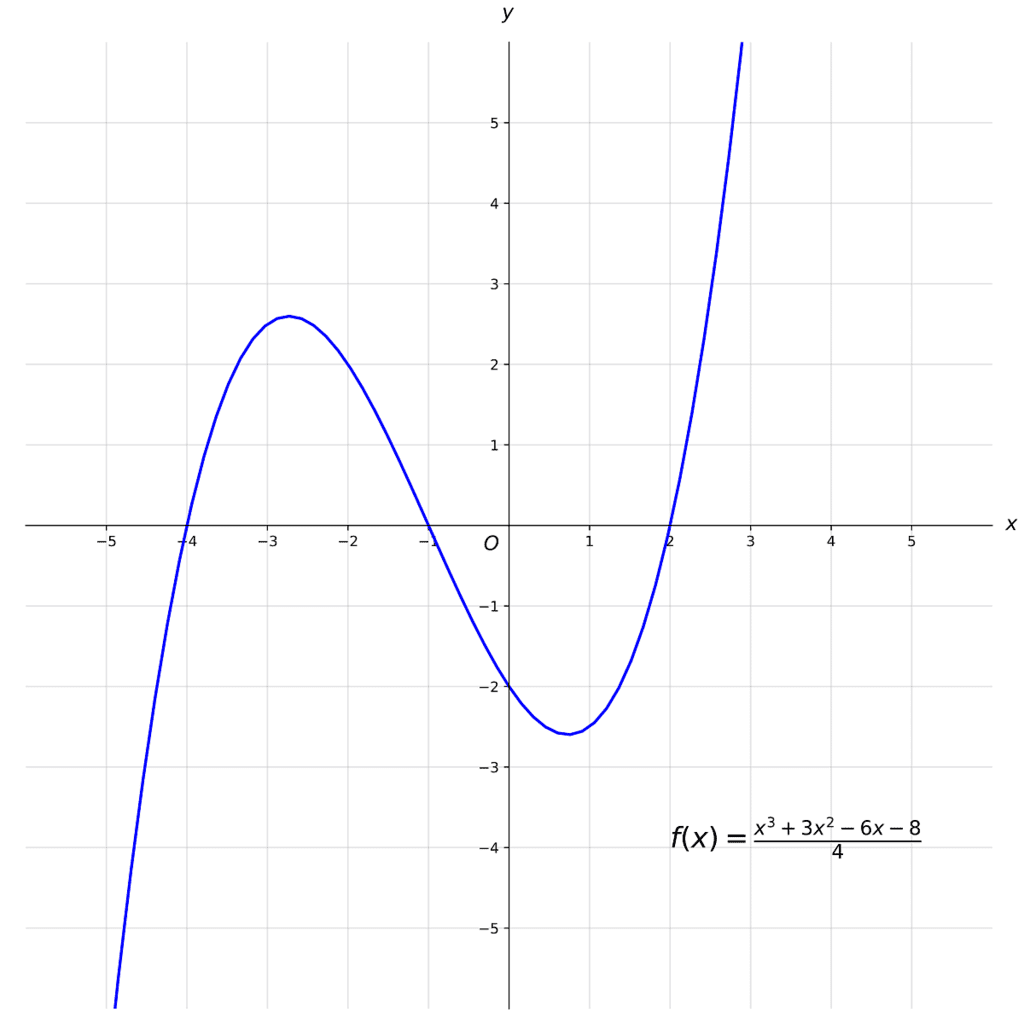 Example of a Graph
Common Graph Forms
Linear Relationship
Equation: y=mx+b
Description: A straight line graph where m is the slope (steepness) of the line, and b is the y-intercept (where the line crosses the y-axis).


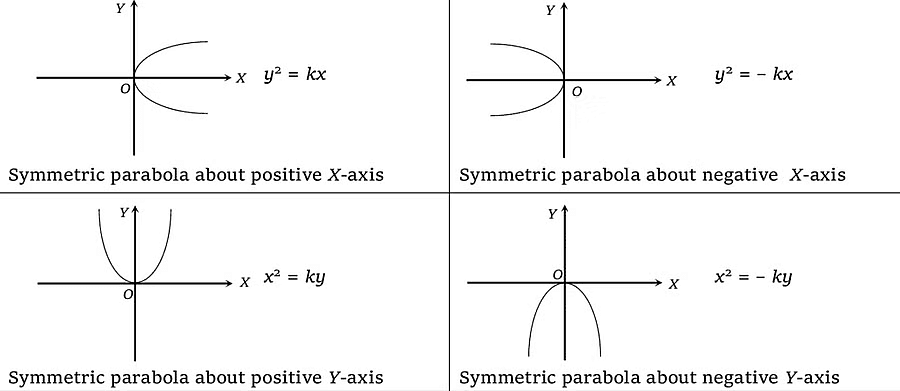
Quadratic Equation/ Parabola
Equation: y=ax2+bx+c
Description: Quadratic graphs are graphs of a quadratic function and can be recognized as they include a squared term.
The shape of a quadratic graph is a parabola.
The graphs have one tuning point – a minimum point or a maximum point.
Cubic Graph
Cubic graphs are graphs of a cubic function and can be recognized as they include a cubed term.
E.g. An x3 term.
The graphs often have two turning points – a minimum point and a maximum point.
 |
Download the notes
Graphs for Physics
|
Download as PDF |
Exponential graphs
Exponential graphs are graphs of an exponential function and can be recognized as they include a kx term where k is the base and x is the exponent (power). The graphs can be a growth curve when k is greater than 1 or a decay curve when k is less than 1.

Reciprocal graph/ Inverse Proportionality
Reciprocal graphs are graphs of a reciprocal function and can be recognized as they include a 1/x term.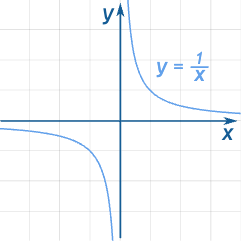
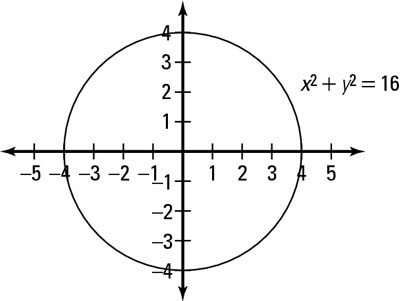
Circle Graph
They are of the form:
x2 + y2 = r2
where r2 is the radius of the circle.
Example 1: Match the graph with its equation
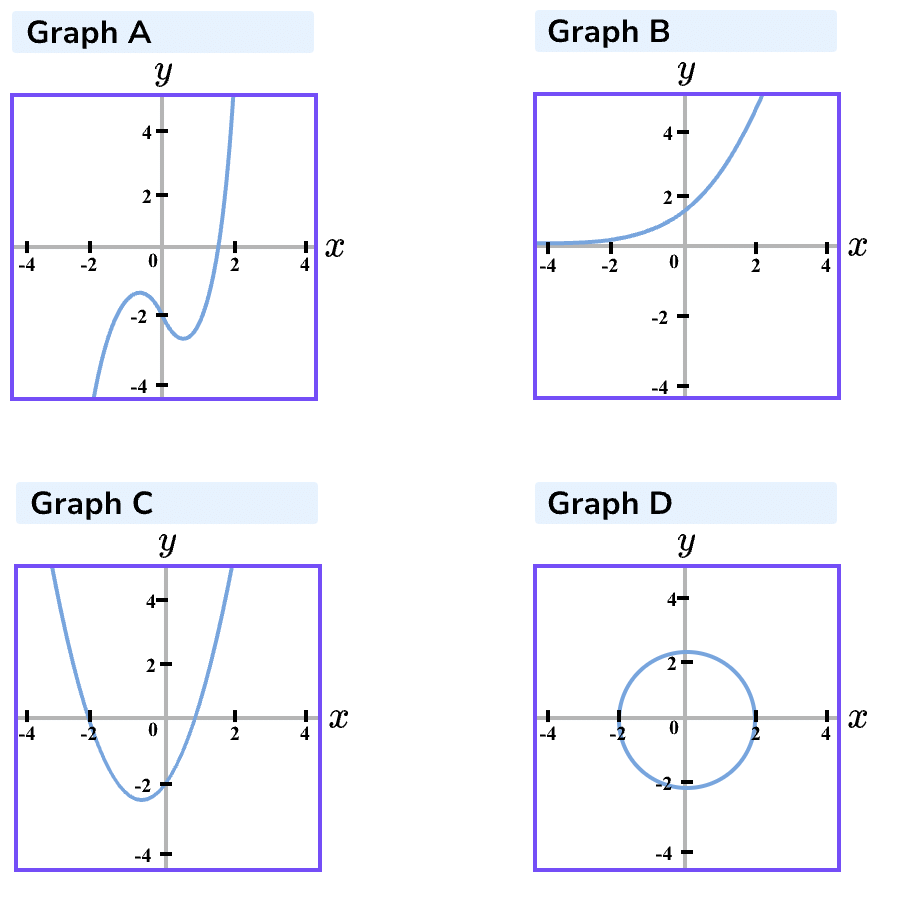
Equation 1: y=2x
Equation 2: y=x2+x-2
Equation 3: x2+y2=4
Equation 4: y=x3-x-2
Solution:
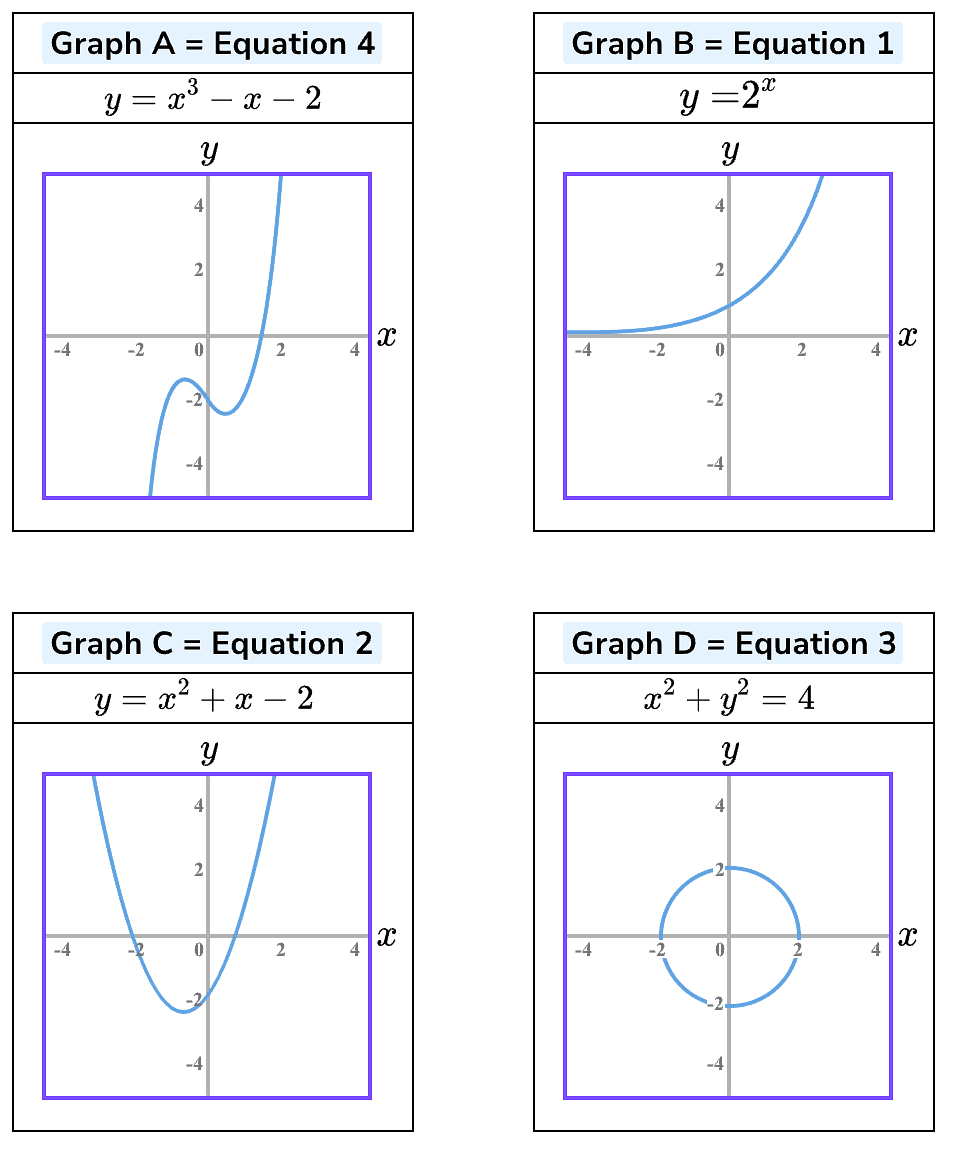
Graph A has 2 vertices; it is very likely to be a cubic function.
Equation 4 is a cubic function with a y-intercept at −2 which is at the end of the equation when x=0
Graph B is a growth curve so its equation will have a term with x as an exponent (power); equation 1 has a term with x as an exponent.
There is a parabola graph, so this is the graph of a quadratic function that has a x2 term. Graph C is Equation 2
There is a circle graph. It has a center (0,0) and radius 22 ; so its equation would be:
x2+y2=22
Graph D is Equation 3
Example 2: Recognise the types of graphs:
Equation 1: x+y=5
Equation 2: y=5/x
Equation 3: x2+y2=25
Equation 4: y=0.5x
Solution:
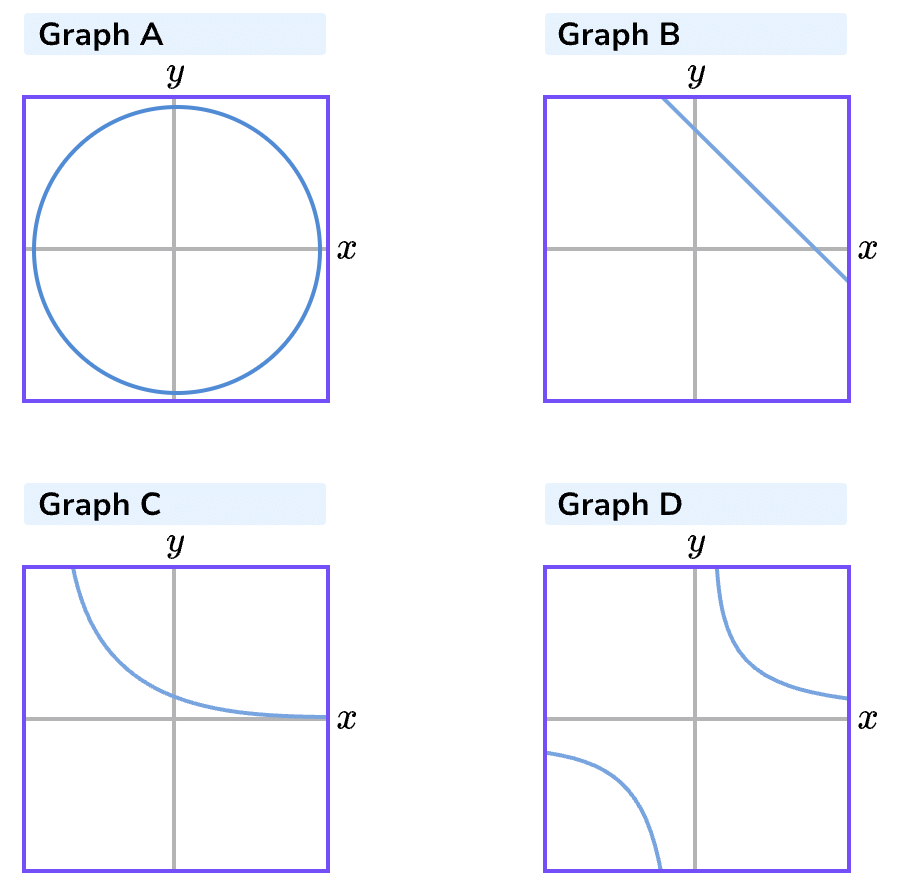
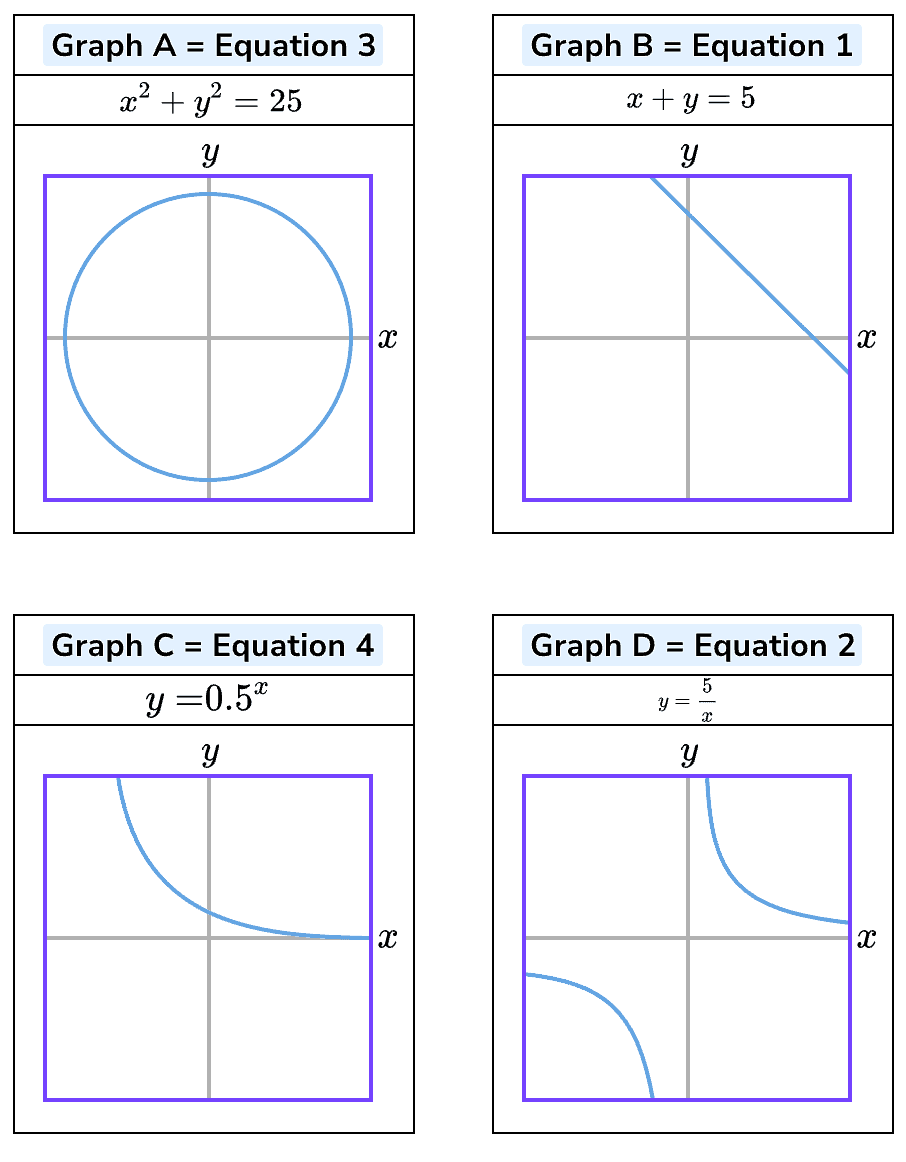
There is a straight line graph so this is the graph of a linear function that has no visible powers. There is no parabola graph so there is no quadratic function.
Graph B is Equation 1
There is a circle graph. It has a center (0,0) so its equation would be:
x2+y2=r2
Graph A is Equation 3
Graph C is not a growth curve but it is a decay curve so its equation will have a term with x as an exponent (power). Equation 4 has a term with x as an exponent.
Graph D is a curve in which 1/x has 2 sections in different quadrants of the coordinate grid. It is likely to be a reciprocal graph with a term. Equation 2 has a term with x as a denominator of a fraction.
FAQs on Graphs for Physics - JEE
| 1. What are the common types of graphs used in physics? |  |
| 2. How do line graphs represent physics data? |  |
| 3. What information can be obtained from a scatter plot in physics? |  |
| 4. How are bar graphs useful in physics? |  |
| 5. What does a histogram represent in physics? |  |


